Reservoir Storage Summary for Climate Divisions on 2025-04-26
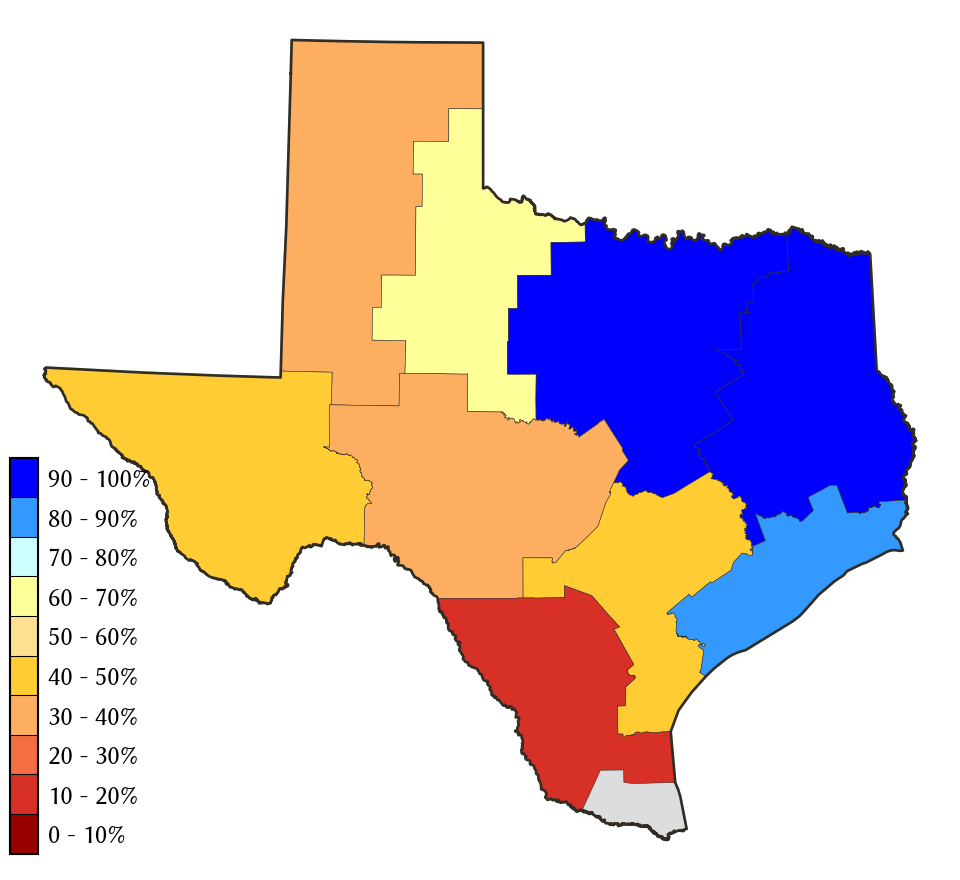
Percent Full
| Today | Yesterday | 2 days ago | 1 week ago | 1 month ago | 3 months ago | 6 months ago | 1 year ago | |
|---|---|---|---|---|---|---|---|---|
| 2025-04-26 | 2025-04-25 | 2025-04-24 | 2025-04-19 | 2025-03-26 | 2025-01-26 | 2024-10-26 | 2024-04-26 | |
| East Texas | 99.7 | 99.7 | 99.6 | 99.2 | 98.2 | 95.7 | 89.4 | 96.3 |
| Edwards Plateau | 33.4 | 33.4 | 33.5 | 32.6 | 33.7 | 34.9 | 35.4 | 31.1 |
| High Plains | 33.7 | 33.6 | 33.6 | 33.4 | 33.6 | 33.8 | 32.2 | 36.6 |
| Low Rolling Plains | 69.9 | 69.9 | 69.7 | 68.7 | 69.0 | 70.6 | 67.5 | 53.4 |
| North Central | 95.4 | 95.3 | 95.2 | 93.3 | 92.5 | 90.0 | 87.2 | 91.7 |
| South | 15.5 | 15.6 | 15.7 | 16.2 | 15.4 | 16.5 | 16.7 | 18.0 |
| South Central | 42.1 | 42.1 | 42.1 | 42.0 | 42.6 | 43.6 | 45.3 | 43.4 |
| Trans Pecos | 40.4 | 40.3 | 40.3 | 40.4 | 40.1 | 39.3 | 35.9 | 38.7 |
| Upper Coast | 87.1 | 87.0 | 87.1 | 86.9 | 77.8 | 84.3 | 89.5 | 97.8 |
*
Percent Full is based on Conservation Storage and Conservation Capacity.
Recent Conditions
| Percent Full |
Reservoir Storage (acre-ft) |
Conservation Storage (acre-ft) |
Conservation Capacity (acre-ft) |
|
|---|---|---|---|---|
| East Texas | 99.7 | 12,819,335 | 9,855,688 | 9,886,943 |
| Edwards Plateau | 33.4 | 1,630,686 | 1,424,698 | 4,261,647 |
| High Plains | 33.7 | 253,795 | 215,381 | 639,362 |
| Low Rolling Plains | 69.9 | 653,168 | 631,548 | 903,870 |
| North Central | 95.4 | 12,265,772 | 10,479,187 | 10,984,350 |
| South | 15.5 | 482,608 | 384,362 | 2,481,249 |
| South Central | 42.1 | 833,454 | 815,742 | 1,936,953 |
| Trans Pecos | 40.4 | 58,616 | 58,616 | 145,165 |
| Upper Coast | 87.1 | 269,154 | 253,662 | 291,293 |
**
The Lower Valley climate division has no contributing Reservoirs present.