Lower-Colorado Planning Region Reservoirs: Monitored Water Supply Reservoirs are 53.2% full on 2025-03-09
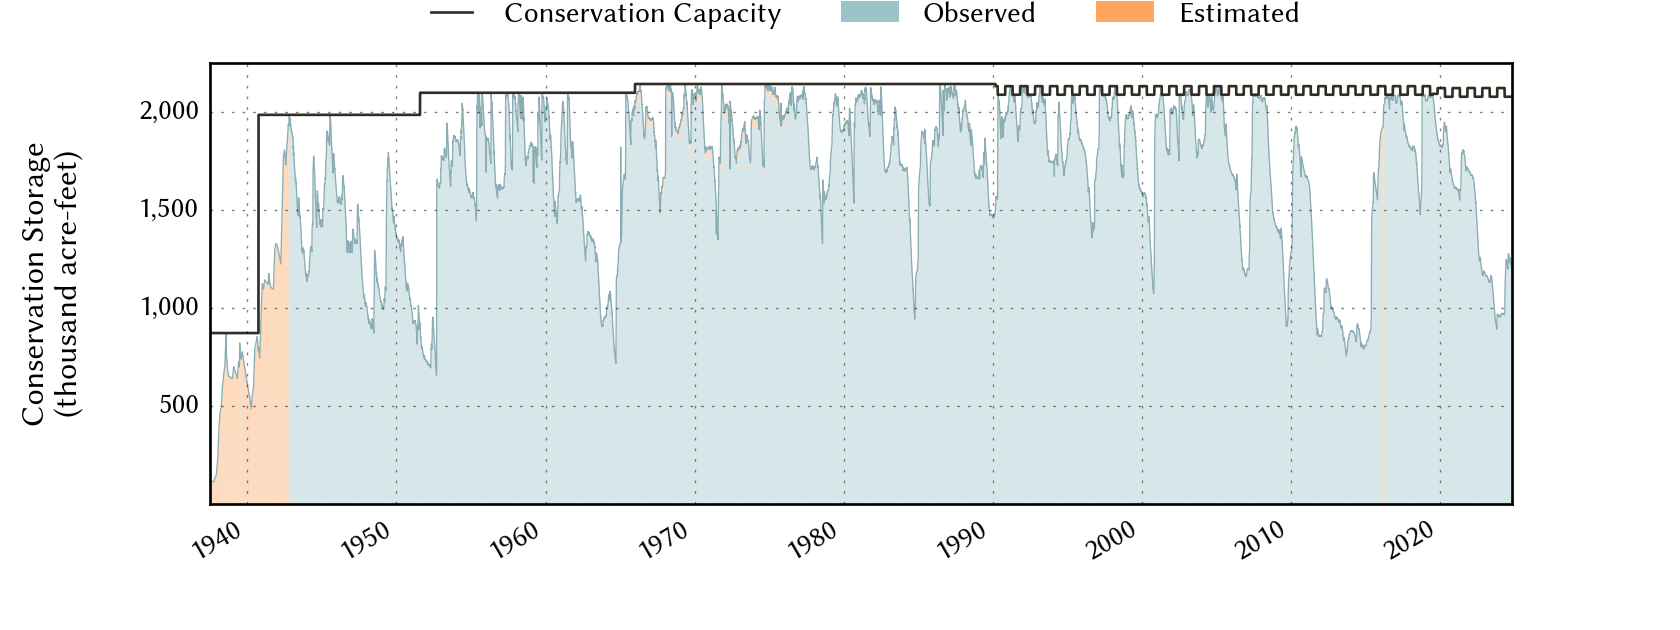
Historical Data
| Date | Percent Full |
Reservoir Storage (acre-ft) |
Conservation Storage (acre-ft) |
Conservation Capacity (acre-ft) |
|
|---|---|---|---|---|---|
| Today | 2025-03-09 | 53.2 | 1,179,560 | 1,129,134 | 2,122,814 |
| Yesterday | 2025-03-08 | 53.2 | 1,180,112 | 1,129,686 | 2,122,814 |
| 2 days ago | 2025-03-07 | 53.2 | 1,179,904 | 1,129,478 | 2,122,814 |
| 1 week ago | 2025-03-02 | 53.4 | 1,183,223 | 1,132,797 | 2,122,814 |
| 1 month ago | 2025-02-09 | 54.0 | 1,196,037 | 1,145,611 | 2,122,814 |
| 3 months ago | 2024-12-09 | 55.8 | 1,235,794 | 1,185,368 | 2,122,814 |
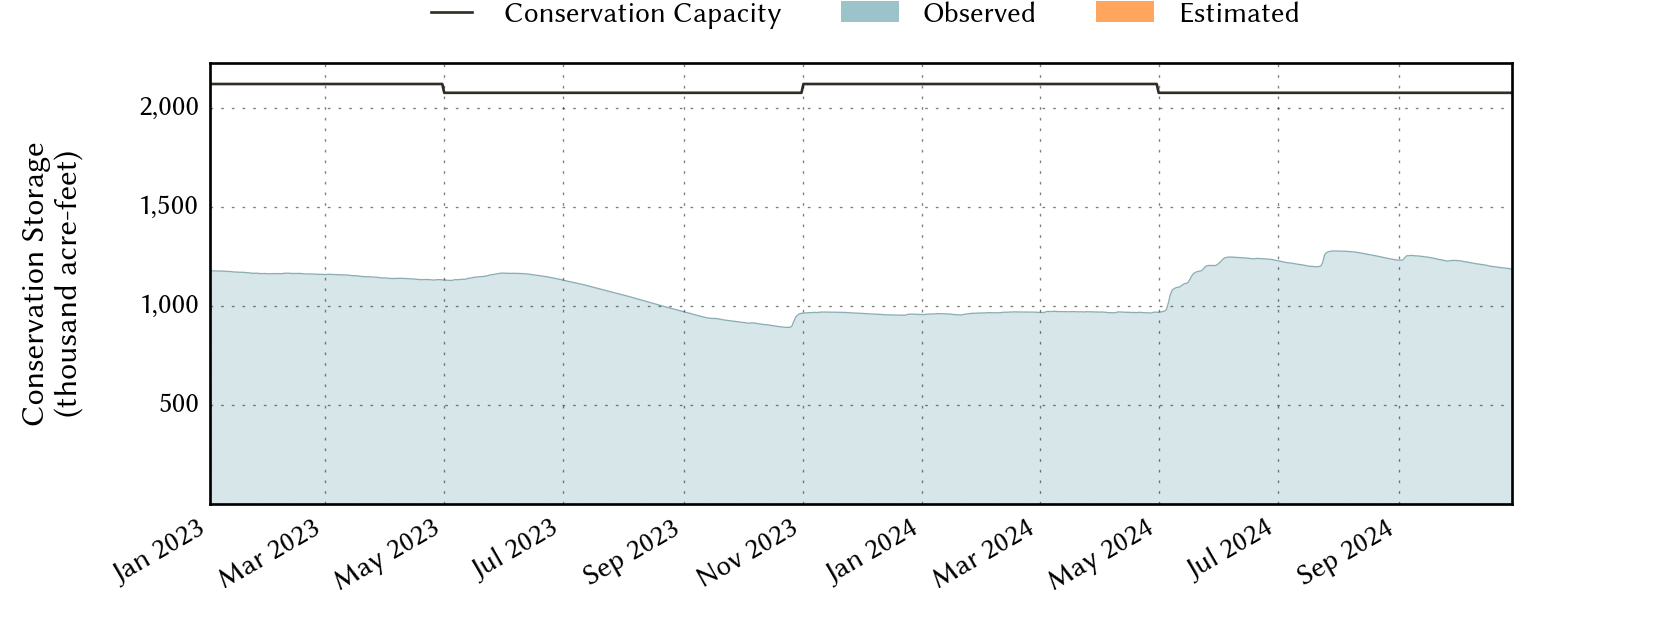
| 6 months ago | 2024-09-09 | 60.4 | 1,304,990 | 1,254,564 | 2,078,327 |
| 1 year ago | 2024-03-09 | 45.9 | 1,024,024 | 973,598 | 2,122,814 |
*
Percent Full is based on Conservation Storage and Conservation Capacity and doesn't account for storage in flood pool.
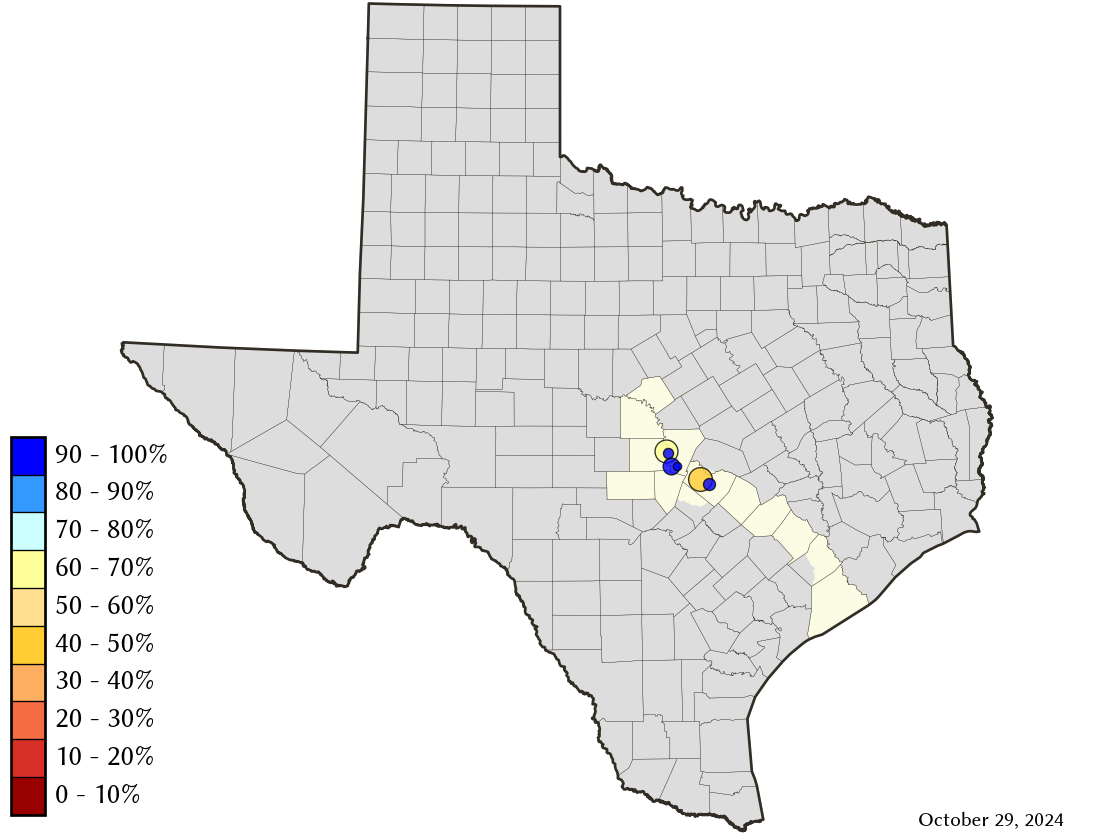
Area Map
Reservoir Storage
| Reservoir | Type | Percent Full |
Water Level (ft) |
Height Above Conservation Pool (ft) |
Reservoir Storage (acre-ft) |
Conservation Storage (acre-ft) |
Conservation Capacity (acre-ft) |
Surface Area (acres) |
|---|---|---|---|---|---|---|---|---|
| Austin |

|
96.4 | 492.25 | -0.55 | 23,721 | 23,112 | 23,972 | 1,548 |
| Buchanan |
|
58.0 | 1,001.65 | -18.35 | 516,465 | 502,803 | 866,694 | 16,386 |
| Inks |
|
94.9 | 887.12 | -0.88 | 13,312 | 13,029 | 13,729 | 783 |
| Lyndon B Johnson |
|
98.8 | 824.79 | -0.21 | 130,269 | 111,429 | 112,778 | 6,412 |
| Marble Falls |
|
94.8 | 736.35 | -0.65 | 7,203 | 7,203 | 7,597 | 601 |
| Travis |

|
42.9 | 636.94 | -44.06 | 488,590 | 471,558 | 1,098,044 | 10,166 |