Austin Area Reservoirs: Monitored Water Supply Reservoirs are 51.4% full on 2025-04-26
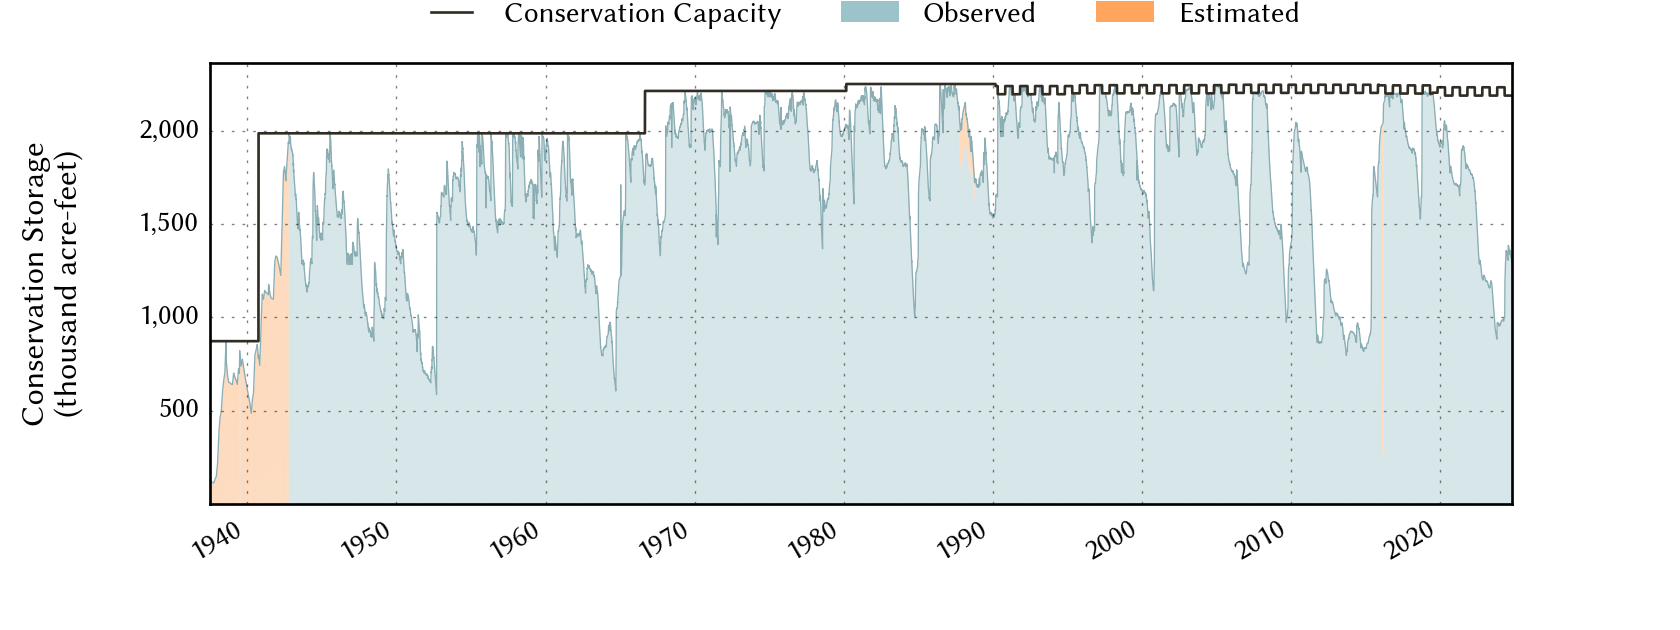
Historical Data
| Date | Percent Full |
Reservoir Storage (acre-ft) |
Conservation Storage (acre-ft) |
Conservation Capacity (acre-ft) |
|
|---|---|---|---|---|---|
| Today | 2025-04-26 | 51.4 | 1,179,287 | 1,148,444 | 2,232,539 |
| Yesterday | 2025-04-25 | 51.5 | 1,180,050 | 1,149,207 | 2,232,539 |
| 2 days ago | 2025-04-24 | 51.5 | 1,180,292 | 1,149,449 | 2,232,539 |
| 1 week ago | 2025-04-19 | 51.7 | 1,184,871 | 1,154,028 | 2,232,539 |
| 1 month ago | 2025-03-26 | 53.0 | 1,214,623 | 1,183,780 | 2,232,539 |
| 3 months ago | 2025-01-26 | 55.0 | 1,259,854 | 1,229,011 | 2,232,539 |
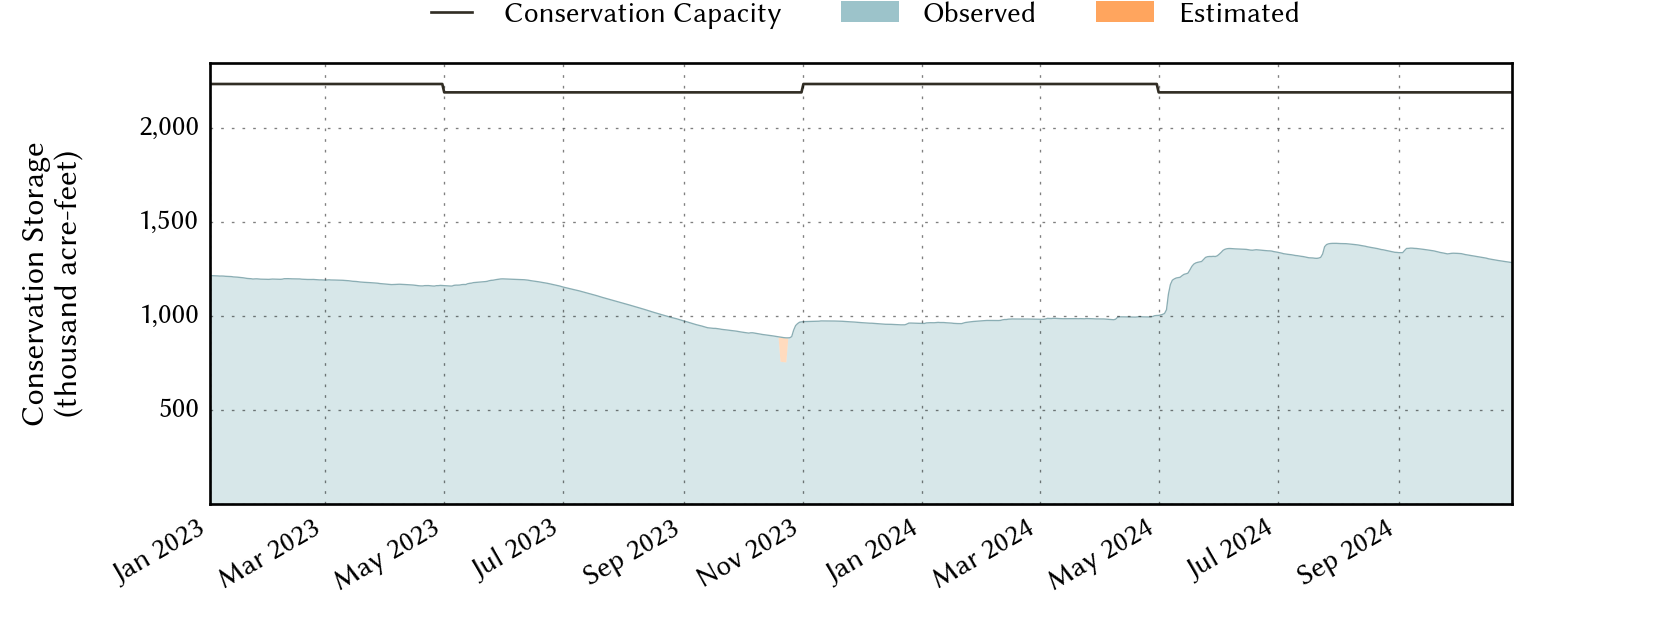
| 6 months ago | 2024-10-26 | 58.9 | 1,318,829 | 1,287,986 | 2,188,052 |
| 1 year ago | 2024-04-26 | 44.5 | 1,024,761 | 993,918 | 2,232,539 |
*
Percent Full is based on Conservation Storage and Conservation Capacity and doesn't account for storage in flood pool.
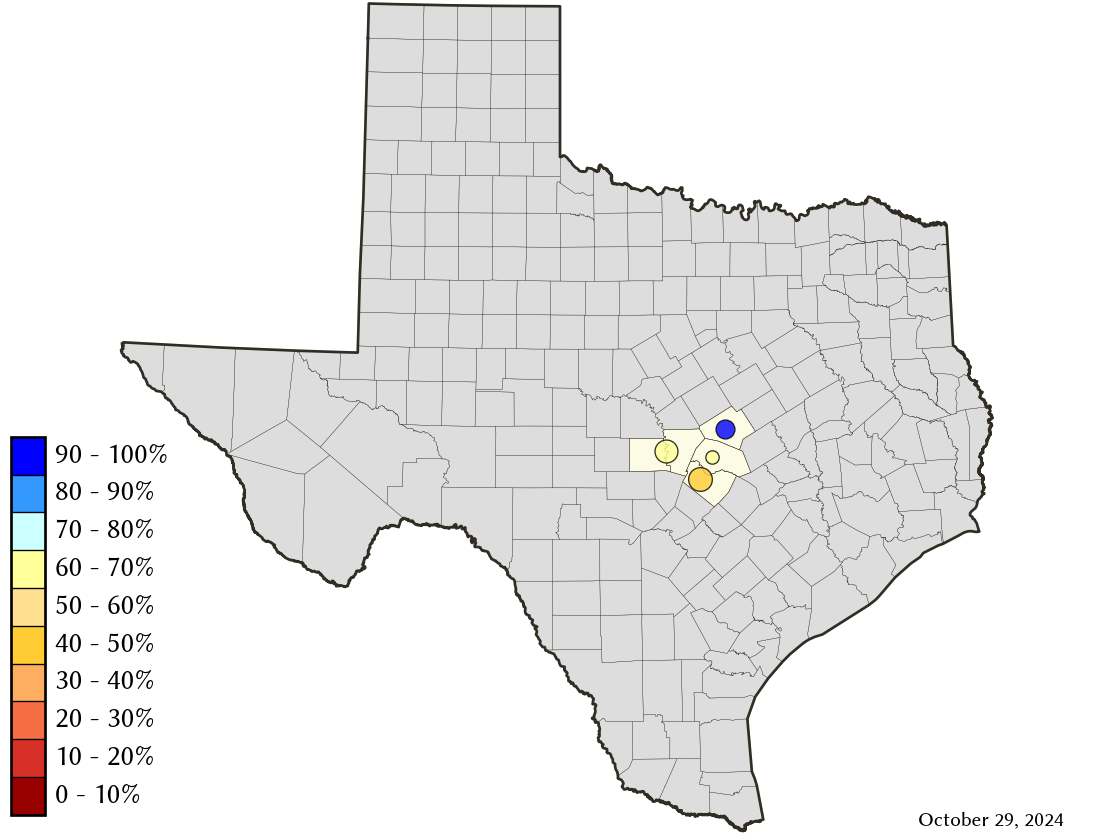
Area Map
Reservoir Storage
| Reservoir | Type | Percent Full |
Water Level (ft) |
Height Above Conservation Pool (ft) |
Reservoir Storage (acre-ft) |
Conservation Storage (acre-ft) |
Conservation Capacity (acre-ft) |
Surface Area (acres) |
|---|---|---|---|---|---|---|---|---|
| Buchanan |

|
53.1 | 998.95 | -21.05 | 473,796 | 460,134 | 866,694 | 15,308 |
| Georgetown |

|
67.0 | 780.22 | -10.78 | 25,517 | 25,454 | 38,005 | 1,023 |
| Stillhouse Hollow |
|
88.9 | 617.83 | -4.17 | 204,277 | 204,191 | 229,796 | 5,838 |
| Travis |
|
41.8 | 635.66 | -45.34 | 475,697 | 458,665 | 1,098,044 | 9,980 |