South-Central Climate Division Reservoirs: Monitored Water Supply Reservoirs are 42.1% full on 2025-04-26
Historical Data
| Date | Percent Full |
Reservoir Storage (acre-ft) |
Conservation Storage (acre-ft) |
Conservation Capacity (acre-ft) |
|
|---|---|---|---|---|---|
| Today | 2025-04-26 | 42.1 | 833,454 | 815,742 | 1,936,953 |
| Yesterday | 2025-04-25 | 42.1 | 833,825 | 816,113 | 1,936,953 |
| 2 days ago | 2025-04-24 | 42.1 | 833,038 | 815,326 | 1,936,953 |
| 1 week ago | 2025-04-19 | 42.0 | 831,695 | 813,983 | 1,936,953 |
| 1 month ago | 2025-03-26 | 42.6 | 843,264 | 825,552 | 1,936,953 |
| 3 months ago | 2025-01-26 | 43.6 | 862,898 | 845,186 | 1,936,953 |
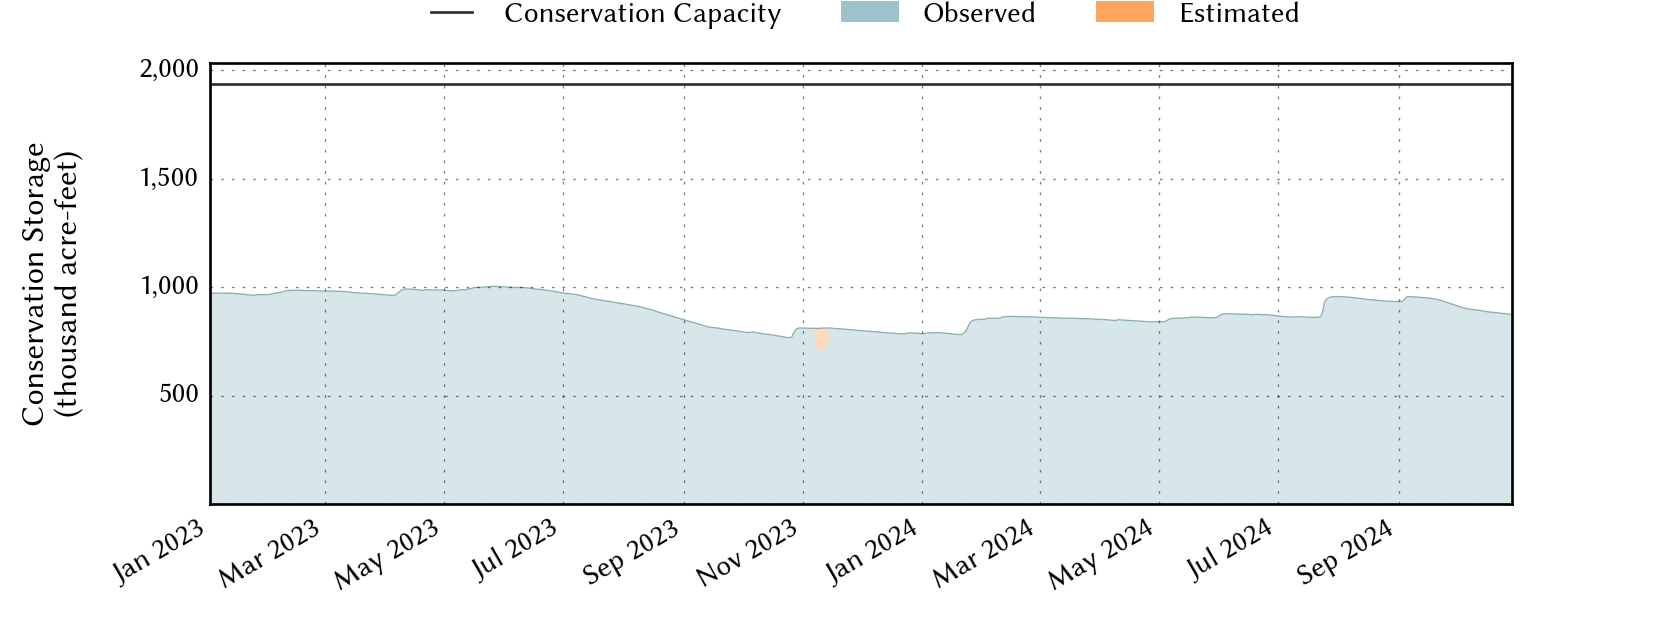
| 6 months ago | 2024-10-26 | 45.3 | 894,593 | 876,881 | 1,936,953 |
| 1 year ago | 2024-04-26 | 43.4 | 878,609 | 840,320 | 1,936,953 |
*
Percent Full is based on Conservation Storage and Conservation Capacity and doesn't account for storage in flood pool.
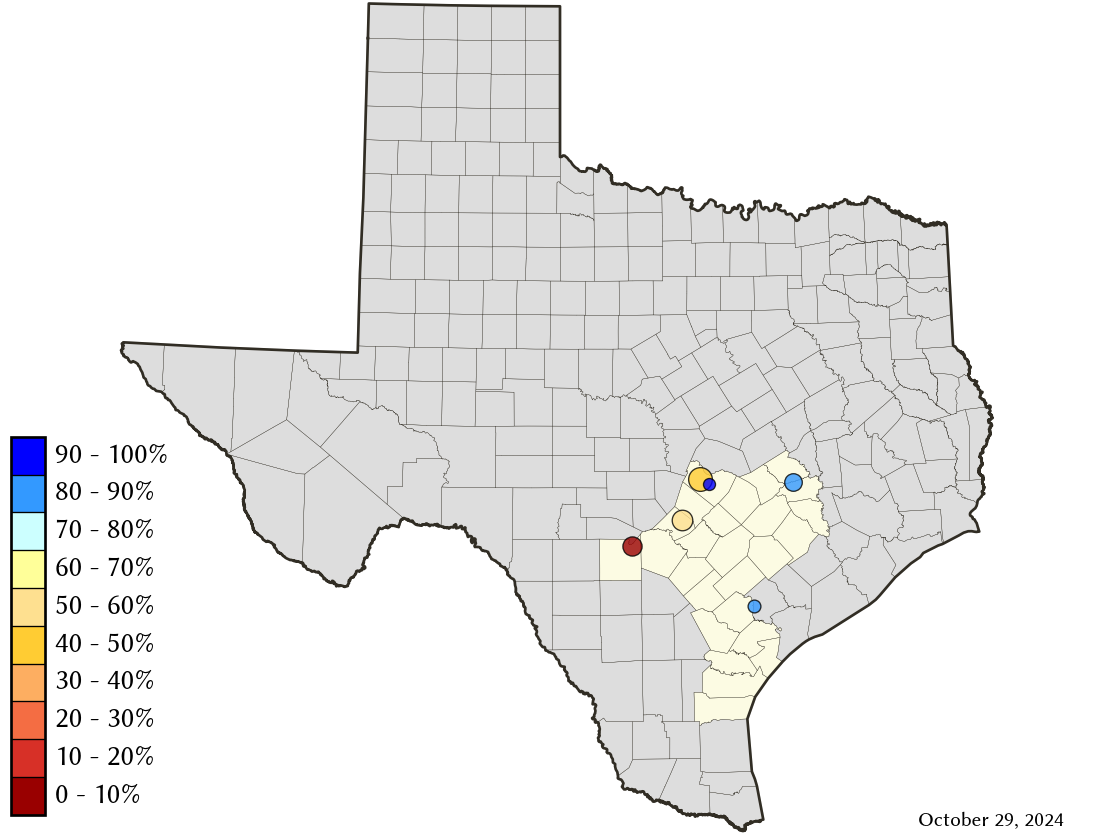
Area Map
Reservoir Storage
| Reservoir | Type | Percent Full |
Water Level (ft) |
Height Above Conservation Pool (ft) |
Reservoir Storage (acre-ft) |
Conservation Storage (acre-ft) |
Conservation Capacity (acre-ft) |
Surface Area (acres) |
|---|---|---|---|---|---|---|---|---|
| Austin |

|
96.9 | 492.32 | -0.48 | 23,829 | 23,220 | 23,972 | 1,552 |
| Canyon |

|
46.5 | 878.02 | -30.98 | 176,234 | 176,163 | 378,781 | 5,000 |
| Coleto Creek |
|
87.5 | 96.37 | -1.63 | 27,157 | 27,157 | 31,040 | 2,423 |
| Medina |
|
2.1 | 969.71 | -94.49 | 5,393 | 5,393 | 254,823 | 519 |
| Somerville |
|
83.3 | 235.66 | -2.34 | 125,144 | 125,144 | 150,293 | 10,309 |
| Travis |
|
41.8 | 635.66 | -45.34 | 475,697 | 458,665 | 1,098,044 | 9,980 |