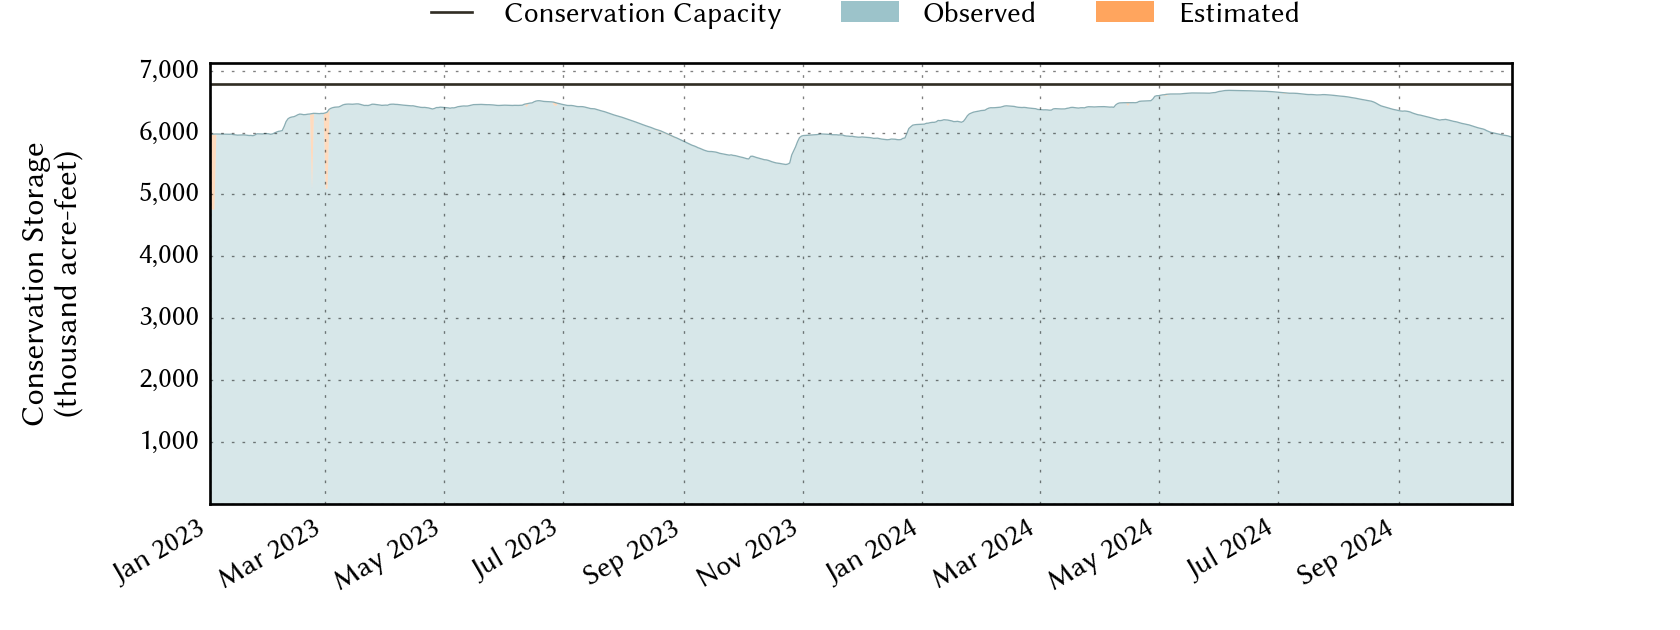
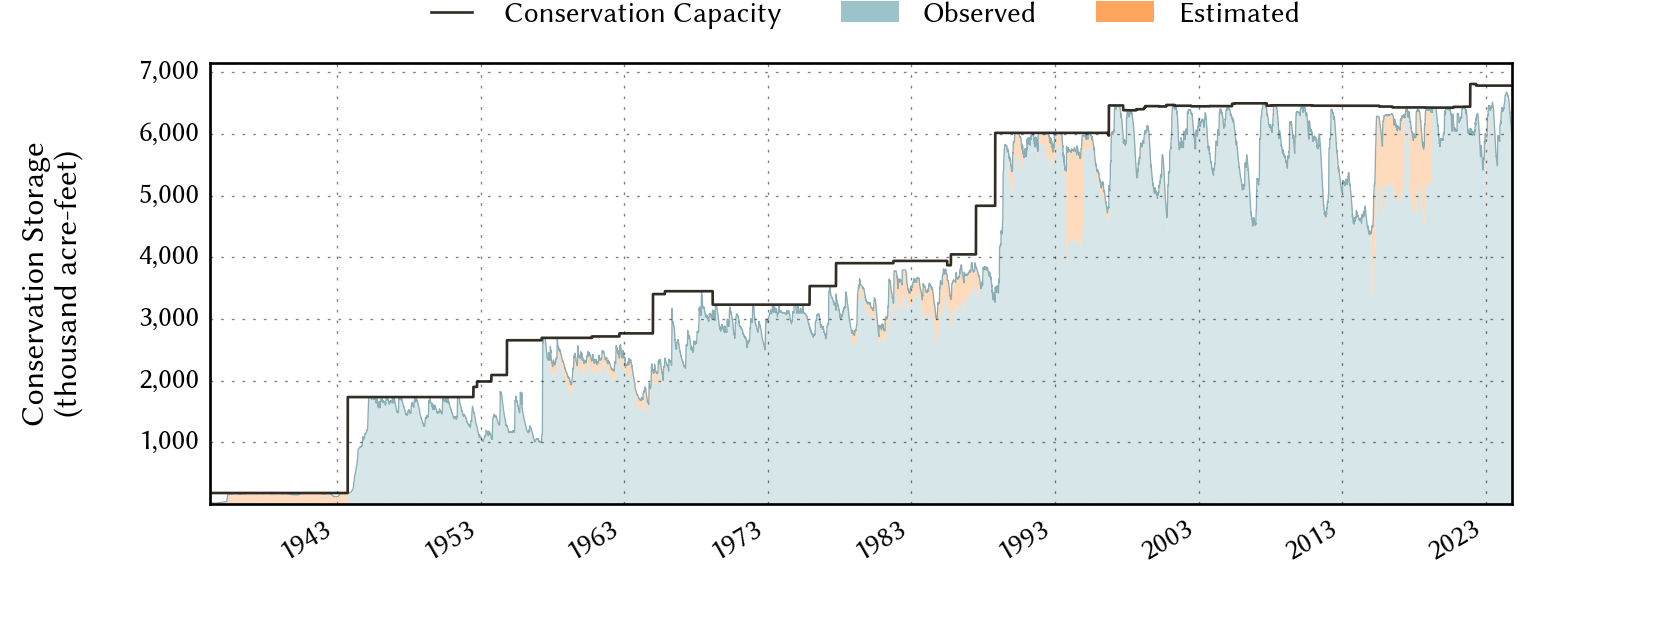
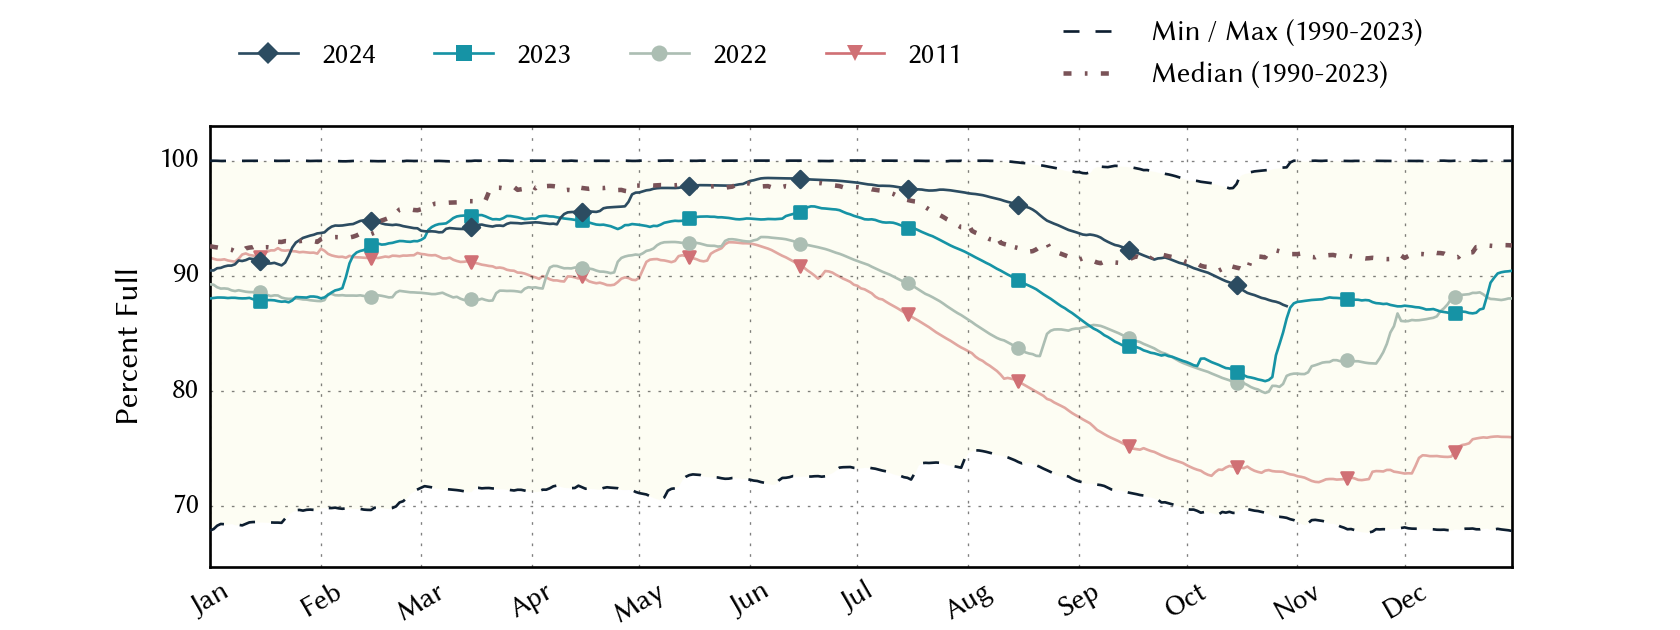
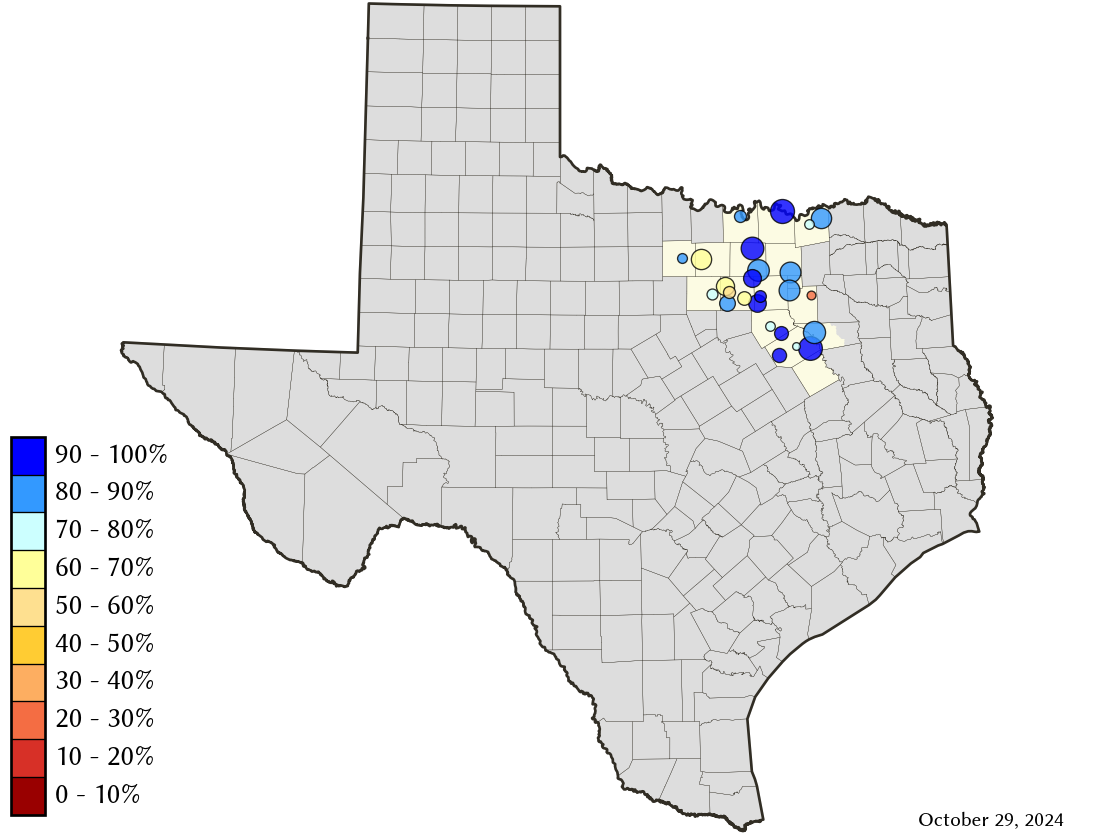
Region-C Planning Region Reservoirs: Monitored Water Supply Reservoirs are 98.2% full on 2025-04-26
Historical Data
| Date | Percent Full |
Reservoir Storage (acre-ft) |
Conservation Storage (acre-ft) |
Conservation Capacity (acre-ft) |
|
|---|---|---|---|---|---|
| Today | 2025-04-26 | 98.2 | 8,298,135 | 6,660,438 | 6,783,467 |
| Yesterday | 2025-04-25 | 98.1 | 8,267,450 | 6,653,478 | 6,783,467 |
| 2 days ago | 2025-04-24 | 97.8 | 8,177,187 | 6,631,853 | 6,783,467 |
| 1 week ago | 2025-04-19 | 95.3 | 7,755,493 | 6,467,690 | 6,783,467 |
| 1 month ago | 2025-03-26 | 94.0 | 7,602,695 | 6,379,519 | 6,783,467 |
| 3 months ago | 2025-01-26 | 90.8 | 7,422,905 | 6,158,909 | 6,783,467 |
| 6 months ago | 2024-10-26 | 87.7 | 7,187,201 | 5,951,180 | 6,783,467 |
| 1 year ago | 2024-04-26 | 96.0 | 7,923,681 | 6,511,846 | 6,783,467 |
*
Percent Full is based on Conservation Storage and Conservation Capacity and doesn't account for storage in flood pool.
Area Map
Reservoir Storage
| Reservoir | Type | Percent Full |
Water Level (ft) |
Height Above Conservation Pool (ft) |
Reservoir Storage (acre-ft) |
Conservation Storage (acre-ft) |
Conservation Capacity (acre-ft) |
Surface Area (acres) |
|---|---|---|---|---|---|---|---|---|
| Arlington |

|
100.0 | 550.58 | 0.58 | 41,308 | 40,157 | 40,157 | - n.a. - |
| Bardwell |

|
100.0 | 421.40 | 0.40 | 45,248 | 43,856 | 43,856 | 3,344 |
| Benbrook |
|
99.7 | 693.94 | -0.06 | 85,428 | 85,428 | 85,648 | 3,629 |
| Bois d'Arc |
|
92.3 | 532.25 | -1.75 | 339,484 | 339,484 | 367,609 | 15,769 |
| Bonham |
|
98.8 | 564.88 | -0.12 | 10,912 | 10,900 | 11,027 | 1,046 |
| Bridgeport |
|
95.9 | 834.75 | -1.25 | 356,983 | 356,983 | 372,183 | 11,982 |
| Cedar Creek |
|
100.0 | 322.09 | 0.09 | 647,732 | 644,686 | 644,686 | - n.a. - |
| Eagle Mountain |
|
84.1 | 645.73 | -3.37 | 155,716 | 155,716 | 185,087 | 8,247 |
| Grapevine |
|
100.0 | 536.72 | 1.72 | 174,773 | 163,064 | 163,064 | - n.a. - |
| Halbert |
|
98.0 | 367.79 | -0.21 | 5,912 | 5,912 | 6,033 | 573 |
| Hubert H Moss |
|
100.0 | 715.81 | 0.81 | 25,038 | 24,058 | 24,058 | - n.a. - |
| Joe Pool |
|
100.0 | 522.60 | 0.60 | 155,055 | 149,629 | 149,629 | 6,821 |
| Lavon |
|
100.0 | 492.63 | 0.63 | 425,716 | 409,757 | 409,757 | 20,983 |
| Lewisville |
|
94.6 | 520.85 | -1.15 | 568,292 | 532,618 | 563,228 | 26,252 |
| Lost Creek |
|
100.0 | 1,010.65 | 1.15 | 12,431 | 11,950 | 11,950 | - n.a. - |
| Mountain Creek |
|
100.0 | 457.63 | 0.63 | 24,506 | 22,850 | 22,850 | 2,867 |
| Navarro Mills |
|
100.0 | 427.15 | 2.65 | 62,985 | 49,827 | 49,827 | - n.a. - |
| New Terrell City |
|
33.4 | 495.41 | -8.59 | 2,879 | 2,868 | 8,583 | 437 |
| Ray Hubbard |
|
99.9 | 435.47 | -0.03 | 438,932 | 438,932 | 439,559 | 20,910 |
| Ray Roberts |
|
100.0 | 632.95 | 0.45 | 801,319 | 788,167 | 788,167 | - n.a. - |
| Richland-Chambers |
|
100.0 | 315.64 | 0.64 | 1,153,444 | 1,099,417 | 1,099,417 | - n.a. - |
| Texoma 1 |
|
100.0 | 619.80 | 2.80 | 2,713,690 | 1,243,801 | 1,243,801 | 87,934 |
| Waxahachie |
|
100.0 | 531.97 | 0.47 | 11,958 | 11,060 | 11,060 | 684 |
| Weatherford |
|
71.2 | 890.89 | -5.11 | 12,684 | 12,684 | 17,812 | 932 |
| Worth |
|
68.1 | 591.63 | -2.37 | 25,710 | 16,634 | 24,419 | 3,131 |
footnotes
1
Lake Texoma straddles the border of Texas and Oklahoma, Texas has rights to 50% of Lake Texoma's total conservation capacity. Percent full, conservation storage and conservation capacity are based on the Texas share.