Region-B Planning Region Reservoirs: Monitored Water Supply Reservoirs are 84.2% full on 2025-04-26
Historical Data
| Date | Percent Full |
Reservoir Storage (acre-ft) |
Conservation Storage (acre-ft) |
Conservation Capacity (acre-ft) |
|
|---|---|---|---|---|---|
| Today | 2025-04-26 | 84.2 | 548,851 | 520,240 | 618,121 |
| Yesterday | 2025-04-25 | 84.0 | 546,271 | 518,986 | 618,121 |
| 2 days ago | 2025-04-24 | 83.6 | 539,434 | 516,902 | 618,121 |
| 1 week ago | 2025-04-19 | 81.0 | 507,909 | 500,900 | 618,121 |
| 1 month ago | 2025-03-26 | 80.8 | 504,343 | 499,287 | 618,121 |
| 3 months ago | 2025-01-26 | 81.6 | 513,454 | 504,626 | 618,121 |
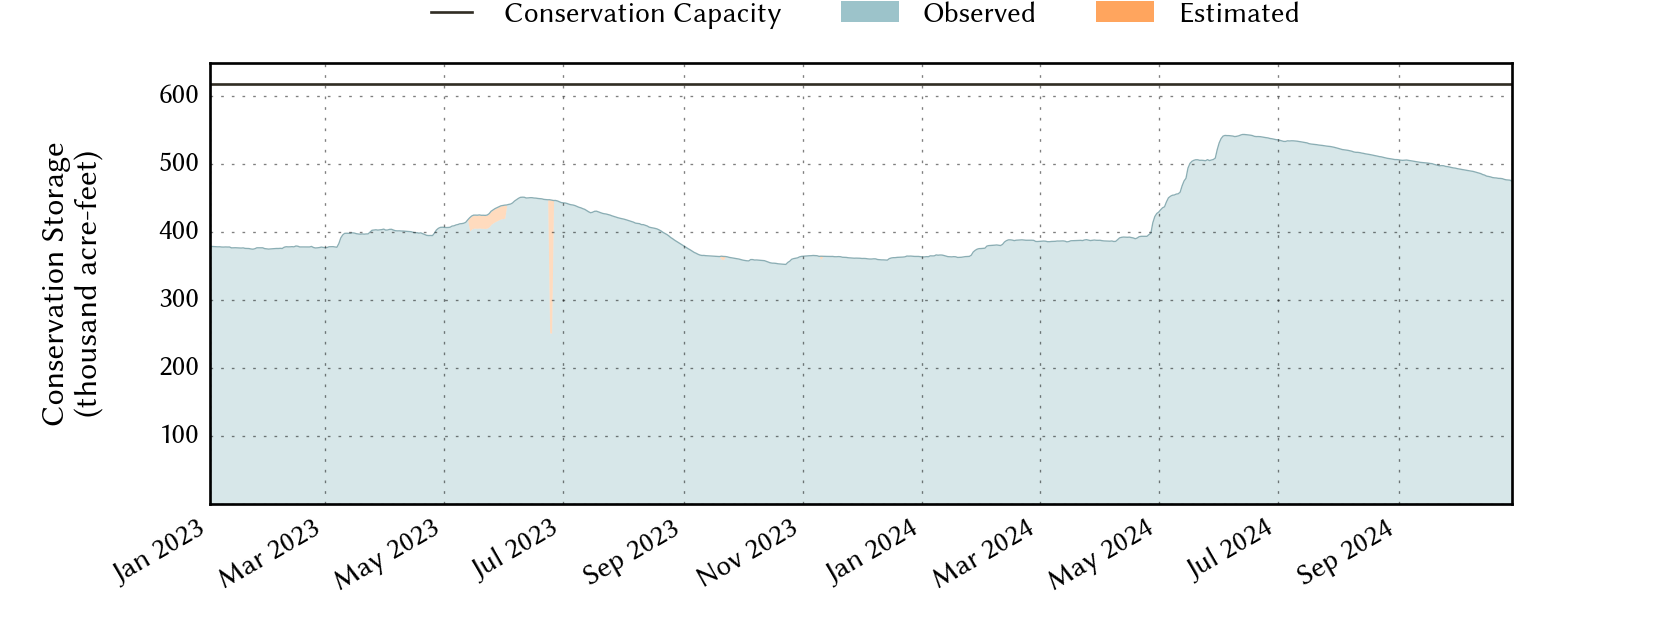
| 6 months ago | 2024-10-26 | 77.1 | 477,961 | 476,747 | 618,121 |
| 1 year ago | 2024-04-26 | 64.1 | 397,652 | 396,438 | 618,121 |
*
Percent Full is based on Conservation Storage and Conservation Capacity and doesn't account for storage in flood pool.
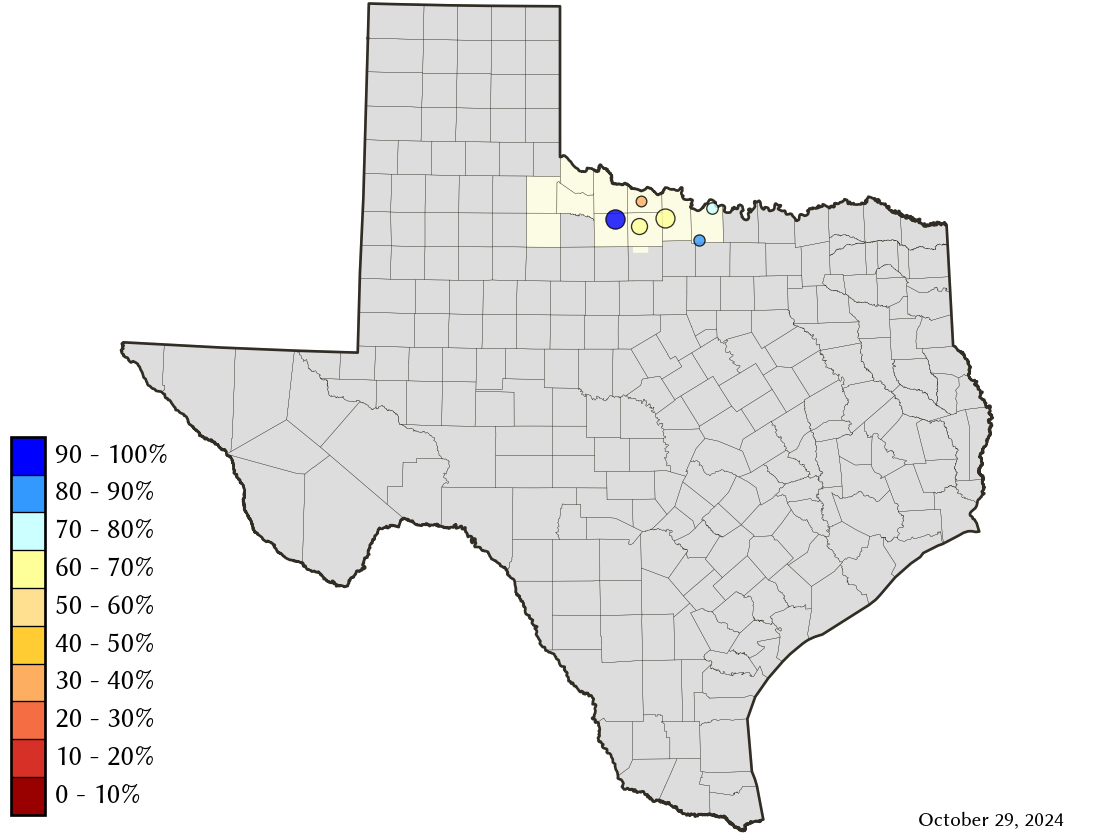
Area Map
Reservoir Storage
| Reservoir | Type | Percent Full |
Water Level (ft) |
Height Above Conservation Pool (ft) |
Reservoir Storage (acre-ft) |
Conservation Storage (acre-ft) |
Conservation Capacity (acre-ft) |
Surface Area (acres) |
|---|---|---|---|---|---|---|---|---|
| Amon G Carter |

|
100.0 | 925.43 | 5.43 | 29,845 | 19,266 | 19,266 | 1,870 |
| Arrowhead |
|
72.8 | 921.29 | -4.71 | 167,758 | 167,758 | 230,359 | 12,077 |
| Kemp |

|
100.0 | 1,145.03 | 1.03 | 261,455 | 245,307 | 245,307 | - n.a. - |
| Kickapoo |
|
70.1 | 1,040.14 | -4.86 | 60,531 | 60,531 | 86,345 | 4,759 |
| Nocona |
|
100.0 | 828.66 | 1.16 | 23,328 | 21,444 | 21,444 | - n.a. - |
| North Fork Buffalo Creek |
|
38.5 | 1,040.37 | -7.63 | 5,934 | 5,934 | 15,400 | 796 |