Dallas Area Reservoirs: Monitored Water Supply Reservoirs are 99.1% full on 2025-04-26
Historical Data
| Date | Percent Full |
Reservoir Storage (acre-ft) |
Conservation Storage (acre-ft) |
Conservation Capacity (acre-ft) |
|
|---|---|---|---|---|---|
| Today | 2025-04-26 | 99.1 | 3,928,581 | 3,804,263 | 3,840,521 |
| Yesterday | 2025-04-25 | 99.0 | 3,926,284 | 3,803,839 | 3,840,521 |
| 2 days ago | 2025-04-24 | 98.9 | 3,908,580 | 3,797,869 | 3,840,521 |
| 1 week ago | 2025-04-19 | 98.2 | 3,873,689 | 3,769,551 | 3,840,521 |
| 1 month ago | 2025-03-26 | 98.0 | 3,840,119 | 3,761,910 | 3,840,521 |
| 3 months ago | 2025-01-26 | 93.0 | 3,641,885 | 3,571,596 | 3,840,521 |
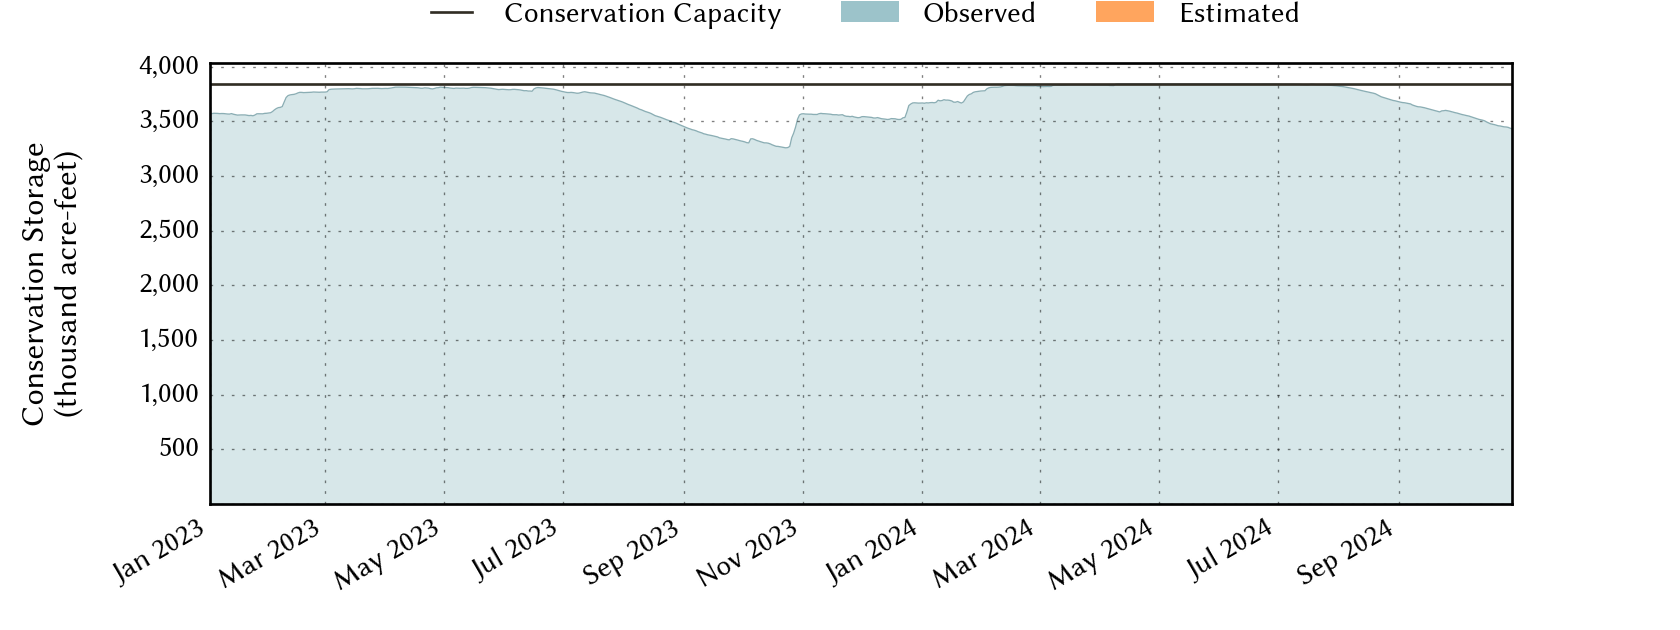
| 6 months ago | 2024-10-26 | 89.8 | 3,517,473 | 3,447,184 | 3,840,521 |
| 1 year ago | 2024-04-26 | 100.0 | 4,059,383 | 3,840,521 | 3,840,521 |
*
Percent Full is based on Conservation Storage and Conservation Capacity and doesn't account for storage in flood pool.
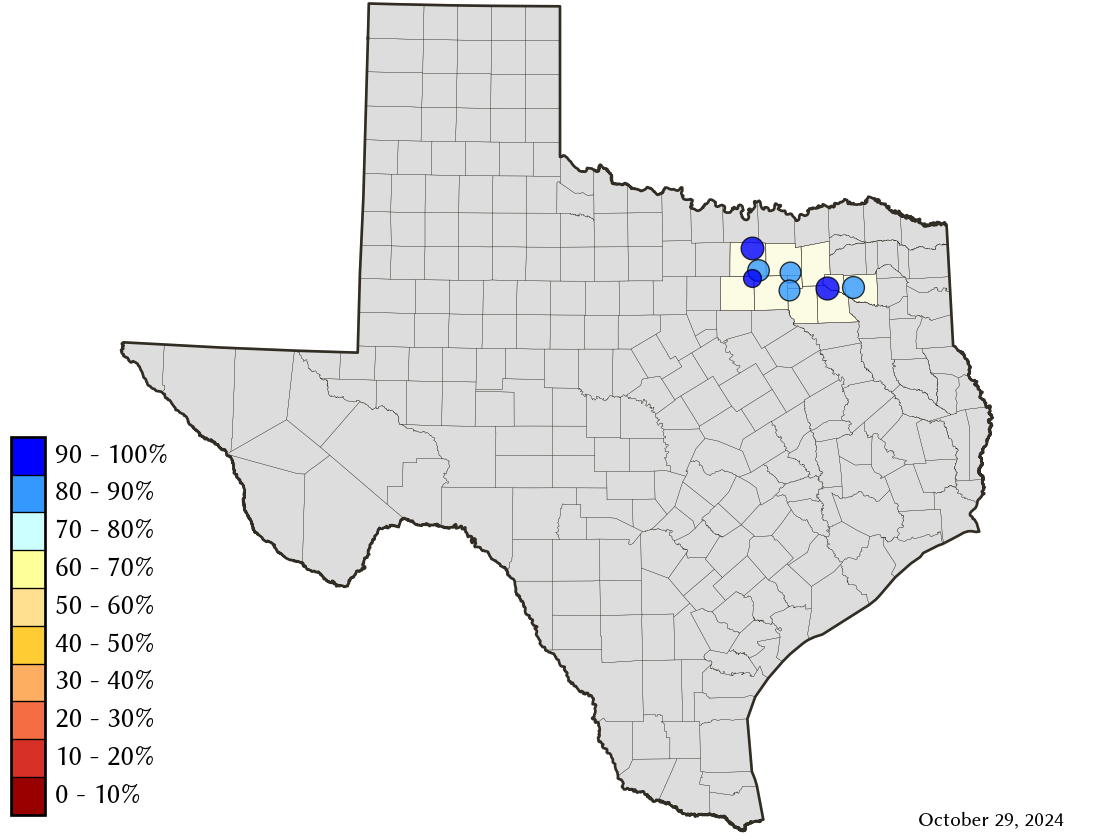
Area Map
Reservoir Storage
| Reservoir | Type | Percent Full |
Water Level (ft) |
Height Above Conservation Pool (ft) |
Reservoir Storage (acre-ft) |
Conservation Storage (acre-ft) |
Conservation Capacity (acre-ft) |
Surface Area (acres) |
|---|---|---|---|---|---|---|---|---|
| Fork |

|
99.2 | 402.81 | -0.19 | 631,483 | 600,040 | 605,061 | 26,304 |
| Grapevine |

|
100.0 | 536.72 | 1.72 | 174,773 | 163,064 | 163,064 | - n.a. - |
| Lavon |
|
100.0 | 492.63 | 0.63 | 425,716 | 409,757 | 409,757 | 20,983 |
| Lewisville |
|
94.6 | 520.85 | -1.15 | 568,292 | 532,618 | 563,228 | 26,252 |
| Ray Hubbard |
|
99.9 | 435.47 | -0.03 | 438,932 | 438,932 | 439,559 | 20,910 |
| Ray Roberts |
|
100.0 | 632.95 | 0.45 | 801,319 | 788,167 | 788,167 | - n.a. - |
| Tawakoni |
|
100.0 | 437.94 | 0.44 | 888,066 | 871,685 | 871,685 | - n.a. - |