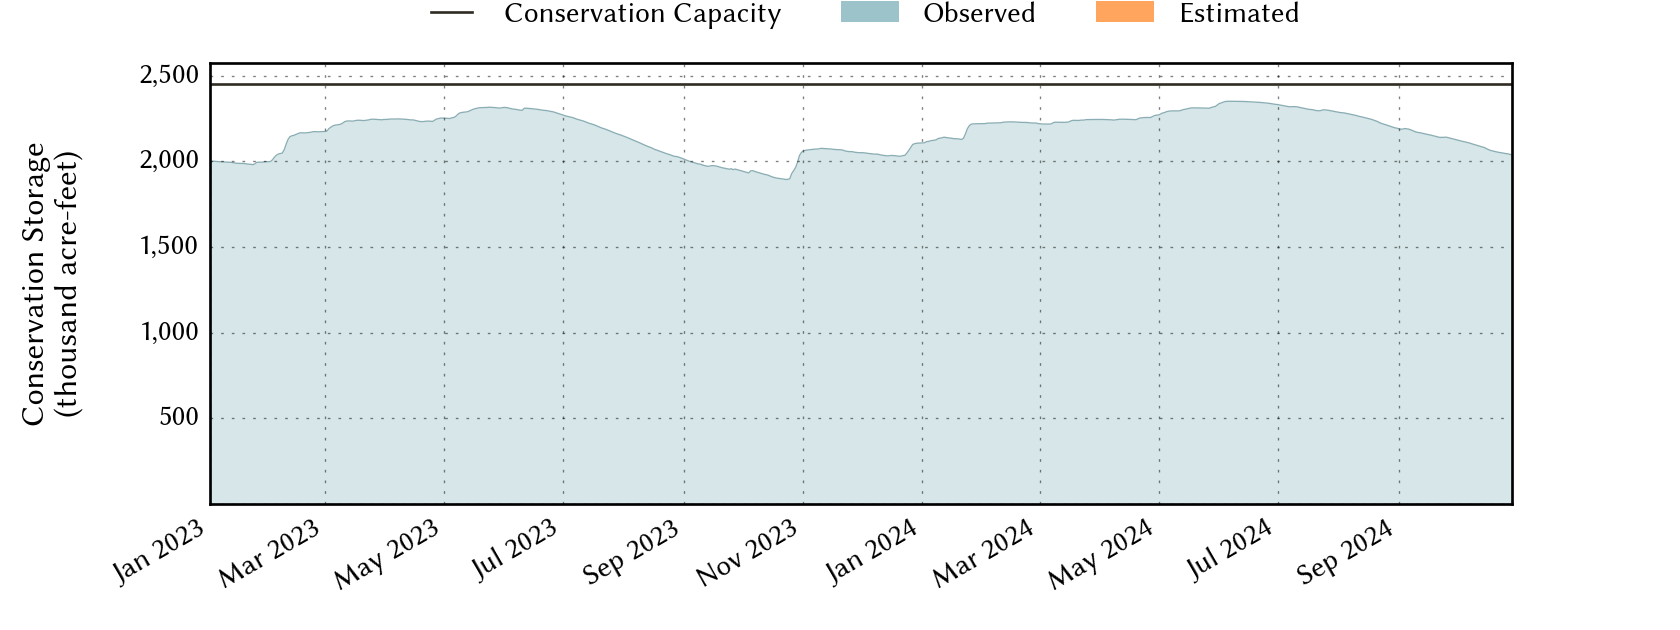
Fort Worth Area Reservoirs: Monitored Water Supply Reservoirs are 97.9% full on 2025-04-26
Historical Data
| Date | Percent Full |
Reservoir Storage (acre-ft) |
Conservation Storage (acre-ft) |
Conservation Capacity (acre-ft) |
|
|---|---|---|---|---|---|
| Today | 2025-04-26 | 97.9 | 2,466,321 | 2,399,021 | 2,451,597 |
| Yesterday | 2025-04-25 | 97.6 | 2,454,414 | 2,392,509 | 2,451,597 |
| 2 days ago | 2025-04-24 | 96.9 | 2,417,047 | 2,376,470 | 2,451,597 |
| 1 week ago | 2025-04-19 | 93.3 | 2,322,778 | 2,287,788 | 2,451,597 |
| 1 month ago | 2025-03-26 | 93.2 | 2,319,462 | 2,284,472 | 2,451,597 |
| 3 months ago | 2025-01-26 | 86.7 | 2,161,222 | 2,126,232 | 2,451,597 |
| 6 months ago | 2024-10-26 | 83.5 | 2,080,880 | 2,045,890 | 2,451,597 |
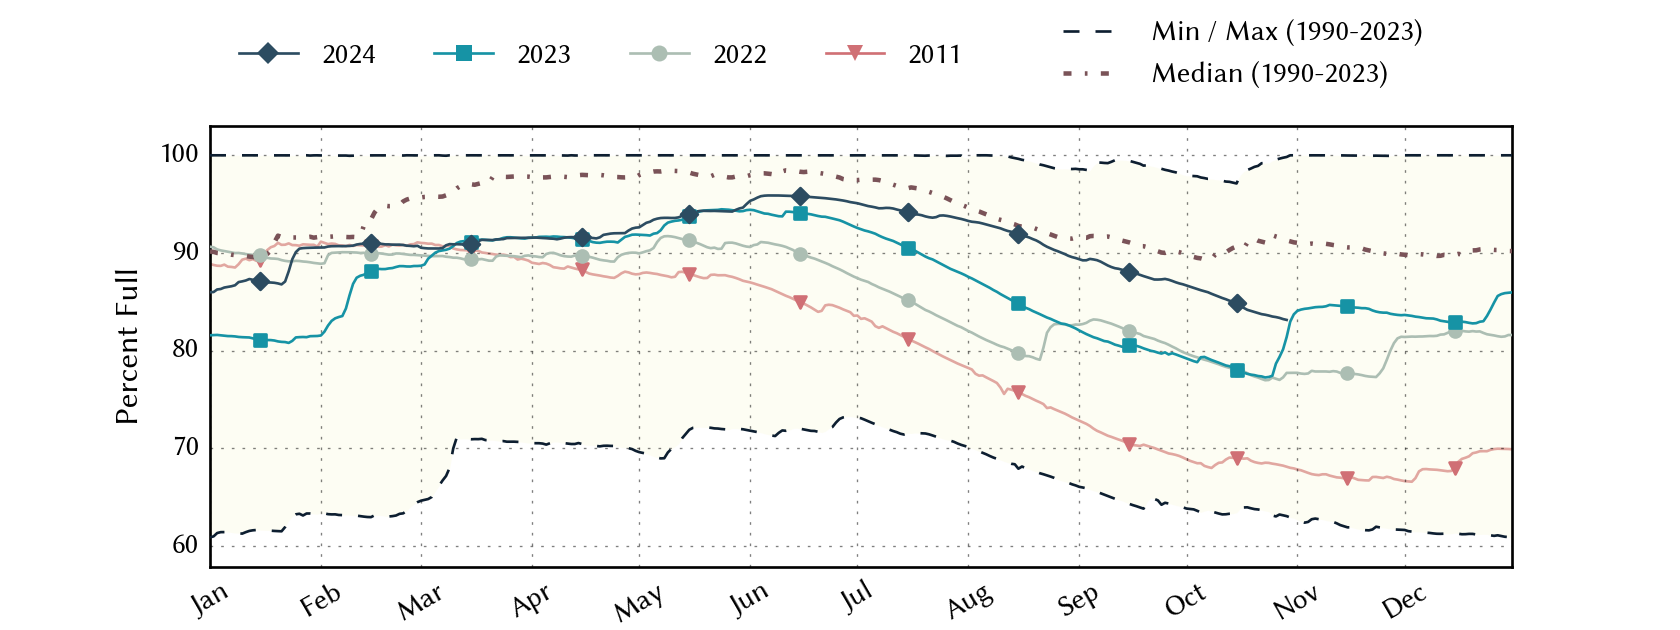
| 1 year ago | 2024-04-26 | 92.0 | 2,304,961 | 2,256,001 | 2,451,597 |
*
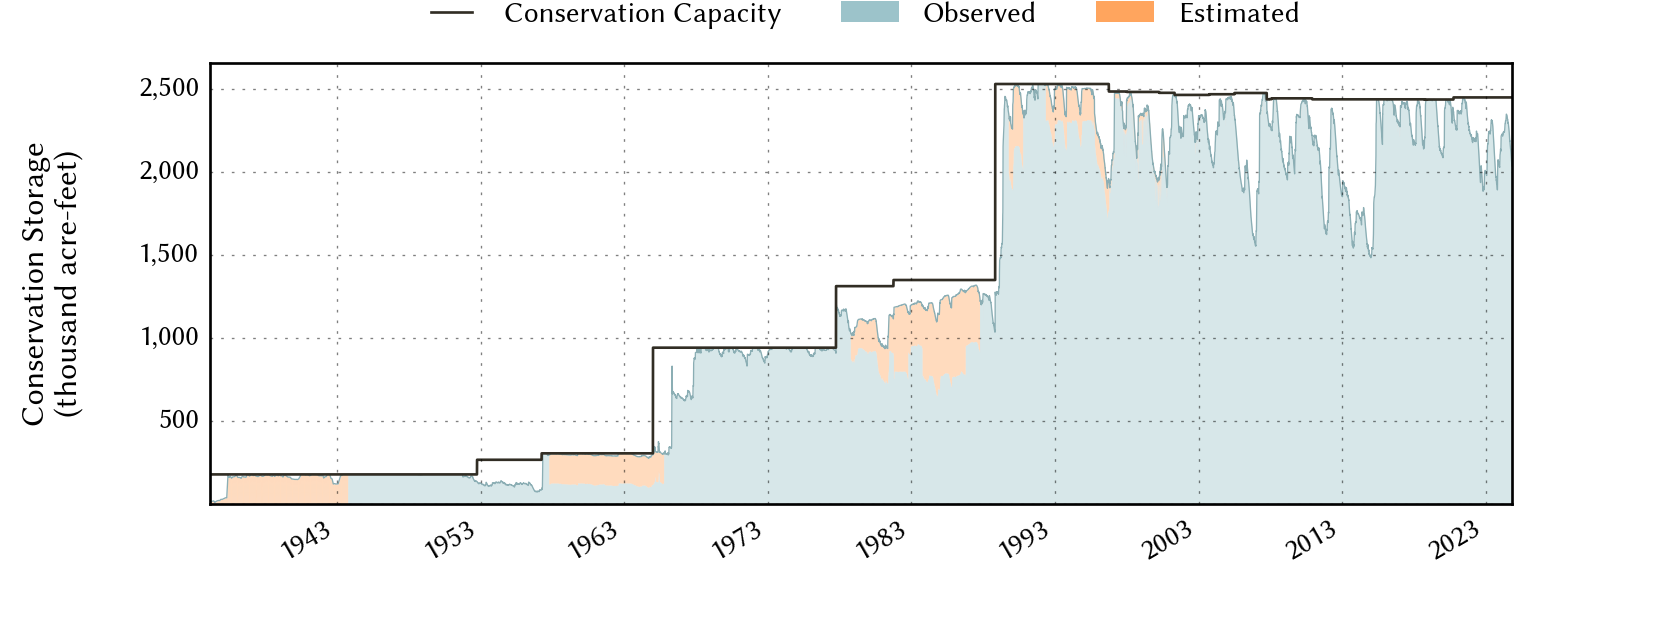
Percent Full is based on Conservation Storage and Conservation Capacity and doesn't account for storage in flood pool.
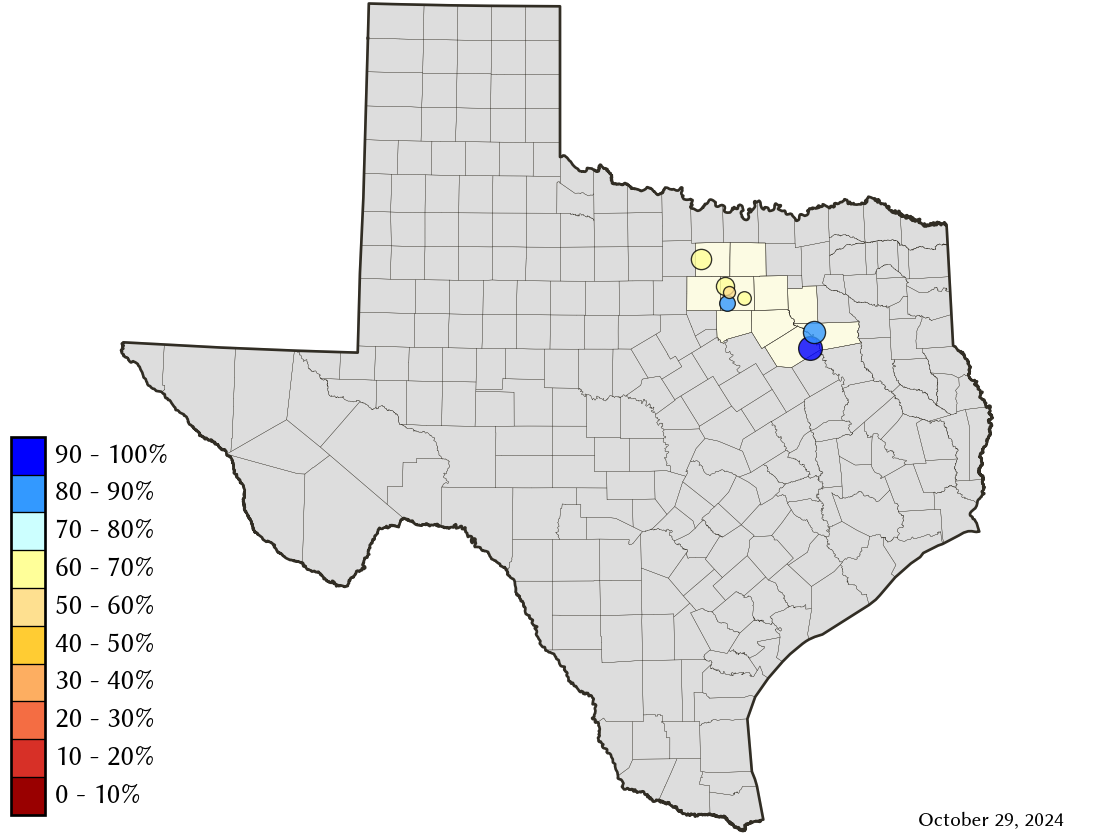
Area Map
Reservoir Storage
| Reservoir | Type | Percent Full |
Water Level (ft) |
Height Above Conservation Pool (ft) |
Reservoir Storage (acre-ft) |
Conservation Storage (acre-ft) |
Conservation Capacity (acre-ft) |
Surface Area (acres) |
|---|---|---|---|---|---|---|---|---|
| Arlington |

|
100.0 | 550.58 | 0.58 | 41,308 | 40,157 | 40,157 | - n.a. - |
| Benbrook |

|
99.7 | 693.94 | -0.06 | 85,428 | 85,428 | 85,648 | 3,629 |
| Bridgeport |
|
95.9 | 834.75 | -1.25 | 356,983 | 356,983 | 372,183 | 11,982 |
| Cedar Creek |
|
100.0 | 322.09 | 0.09 | 647,732 | 644,686 | 644,686 | - n.a. - |
| Eagle Mountain |
|
84.1 | 645.73 | -3.37 | 155,716 | 155,716 | 185,087 | 8,247 |
| Richland-Chambers |
|
100.0 | 315.64 | 0.64 | 1,153,444 | 1,099,417 | 1,099,417 | - n.a. - |
| Worth |
|
68.1 | 591.63 | -2.37 | 25,710 | 16,634 | 24,419 | 3,131 |