Brazos-G Planning Region Reservoirs: Monitored Water Supply Reservoirs are 89.3% full on 2025-04-26
Historical Data
| Date | Percent Full |
Reservoir Storage (acre-ft) |
Conservation Storage (acre-ft) |
Conservation Capacity (acre-ft) |
|
|---|---|---|---|---|---|
| Today | 2025-04-26 | 89.3 | 3,148,626 | 3,081,169 | 3,448,550 |
| Yesterday | 2025-04-25 | 89.4 | 3,146,146 | 3,082,743 | 3,448,550 |
| 2 days ago | 2025-04-24 | 89.4 | 3,127,291 | 3,082,600 | 3,448,550 |
| 1 week ago | 2025-04-19 | 88.5 | 3,069,308 | 3,050,575 | 3,448,550 |
| 1 month ago | 2025-03-26 | 88.6 | 3,068,838 | 3,054,101 | 3,448,550 |
| 3 months ago | 2025-01-26 | 88.8 | 3,074,185 | 3,061,189 | 3,448,550 |
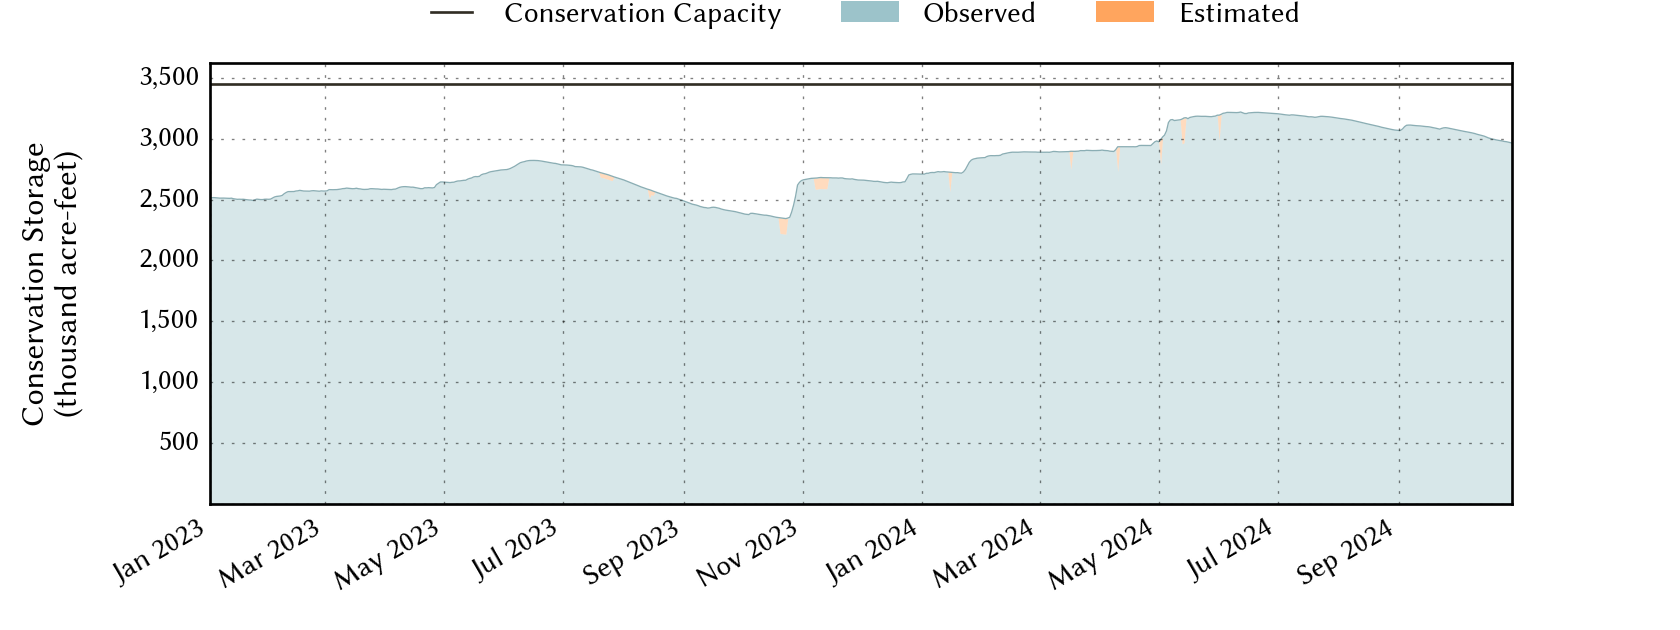
| 6 months ago | 2024-10-26 | 86.2 | 2,986,738 | 2,973,721 | 3,448,550 |
| 1 year ago | 2024-04-26 | 85.3 | 3,001,553 | 2,943,200 | 3,448,550 |
*
Percent Full is based on Conservation Storage and Conservation Capacity and doesn't account for storage in flood pool.
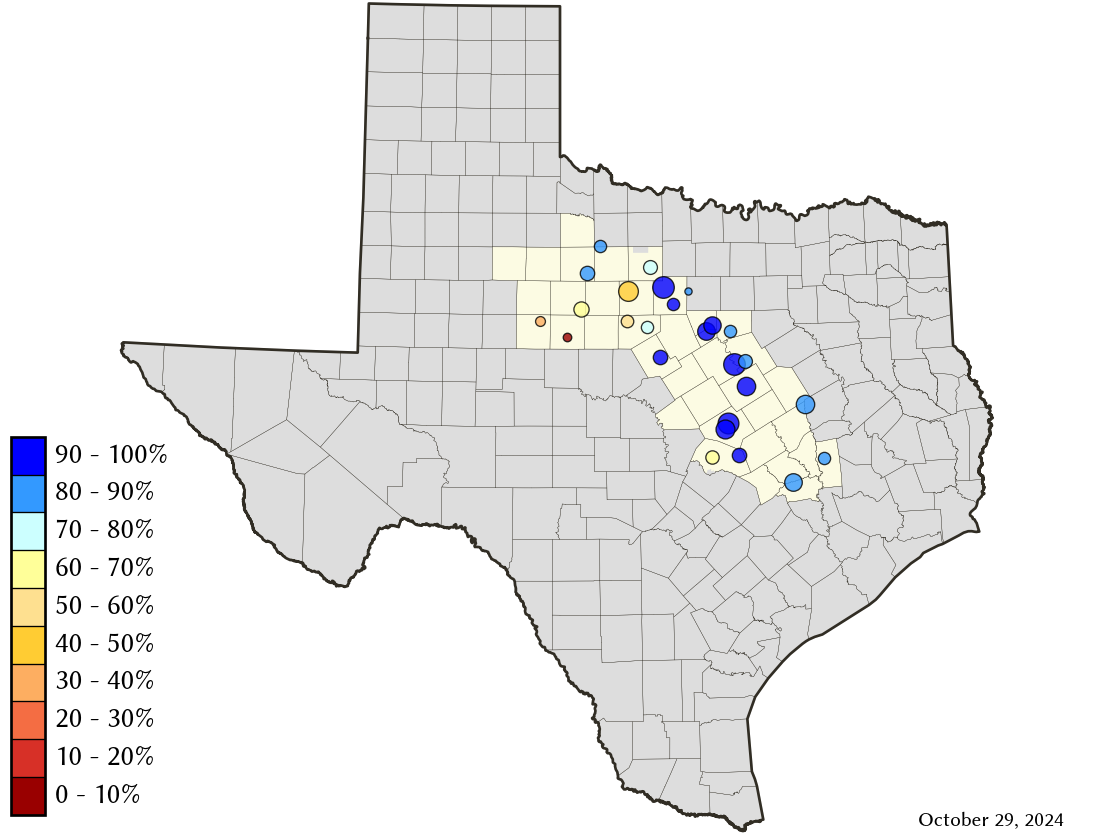
Area Map
Reservoir Storage
| Reservoir | Type | Percent Full |
Water Level (ft) |
Height Above Conservation Pool (ft) |
Reservoir Storage (acre-ft) |
Conservation Storage (acre-ft) |
Conservation Capacity (acre-ft) |
Surface Area (acres) |
|---|---|---|---|---|---|---|---|---|
| Abilene |

|
6.7 | 1,990.87 | -21.43 | 531 | 531 | 7,900 | 126 |
| Aquilla |

|
100.0 | 537.91 | 0.41 | 44,553 | 43,243 | 43,243 | 3,132 |
| Belton |
|
91.2 | 590.83 | -3.17 | 394,490 | 394,490 | 432,631 | 11,642 |
| Cisco |
|
57.5 | 1,509.54 | -12.92 | 16,665 | 16,665 | 29,003 | 727 |
| Fort Phantom Hill |
|
71.9 | 1,630.26 | -5.64 | 50,364 | 50,358 | 70,030 | 3,101 |
| Georgetown |
|
67.0 | 780.22 | -10.78 | 25,517 | 25,454 | 38,005 | 1,023 |
| Gibbons Creek |
|
81.3 | 244.97 | -2.03 | 22,604 | 20,900 | 25,721 | 2,203 |
| Graham |
|
100.0 | 1,075.99 | 0.99 | 47,786 | 45,288 | 45,288 | - n.a. - |
| Granbury |
|
93.4 | 691.60 | -1.10 | 125,089 | 124,180 | 132,949 | 7,771 |
| Granger |
|
100.0 | 504.21 | 0.21 | 52,689 | 51,822 | 51,822 | - n.a. - |
| Hubbard Creek |
|
49.0 | 1,170.67 | -12.64 | 158,327 | 153,451 | 313,298 | 9,834 |
| Leon |
|
100.0 | 1,375.28 | 0.28 | 28,537 | 27,762 | 27,762 | - n.a. - |
| Limestone |
|
93.2 | 361.86 | -1.14 | 189,860 | 189,860 | 203,780 | 12,022 |
| Millers Creek |
|
78.9 | 1,331.23 | -2.77 | 22,398 | 21,115 | 26,768 | 1,844 |
| Mineral Wells |
|
90.2 | 861.86 | -1.14 | 4,756 | 4,756 | 5,273 | 442 |
| Palo Pinto |
|
97.8 | 866.73 | -0.27 | 26,566 | 26,180 | 26,766 | 2,164 |
| Pat Cleburne |
|
100.0 | 733.97 | 0.47 | 26,748 | 26,008 | 26,008 | - n.a. - |
| Possum Kingdom |
|
98.5 | 998.56 | -0.44 | 530,302 | 530,302 | 538,139 | 17,709 |
| Proctor |
|
100.0 | 1,163.67 | 1.67 | 62,730 | 54,762 | 54,762 | - n.a. - |
| Somerville |
|
83.3 | 235.66 | -2.34 | 125,144 | 125,144 | 150,293 | 10,309 |
| Squaw Creek |
|
100.0 | 775.58 | 0.58 | 153,117 | 151,250 | 151,250 | - n.a. - |
| Stamford |
|
94.2 | 1,416.44 | -0.36 | 48,580 | 48,577 | 51,570 | 4,911 |
| Stillhouse Hollow |
|
88.9 | 617.83 | -4.17 | 204,277 | 204,191 | 229,796 | 5,838 |
| Sweetwater |
|
33.9 | 2,099.02 | -17.48 | 4,158 | 4,158 | 12,267 | 310 |
| Waco |
|
92.9 | 460.50 | -1.70 | 176,120 | 175,914 | 189,418 | 7,794 |
| Whitney |
|
100.0 | 534.69 | 1.69 | 606,718 | 564,808 | 564,808 | - n.a. - |