North-Central Climate Division Reservoirs: Monitored Water Supply Reservoirs are 95.4% full on 2025-04-26
Historical Data
| Date | Percent Full |
Reservoir Storage (acre-ft) |
Conservation Storage (acre-ft) |
Conservation Capacity (acre-ft) |
|
|---|---|---|---|---|---|
| Today | 2025-04-26 | 95.4 | 12,265,772 | 10,479,187 | 10,984,350 |
| Yesterday | 2025-04-25 | 95.3 | 12,232,003 | 10,472,779 | 10,984,350 |
| 2 days ago | 2025-04-24 | 95.2 | 12,126,195 | 10,452,879 | 10,984,350 |
| 1 week ago | 2025-04-19 | 93.3 | 11,635,650 | 10,245,168 | 10,984,350 |
| 1 month ago | 2025-03-26 | 92.5 | 11,441,592 | 10,157,224 | 10,984,350 |
| 3 months ago | 2025-01-26 | 90.0 | 11,197,784 | 9,882,319 | 10,984,350 |
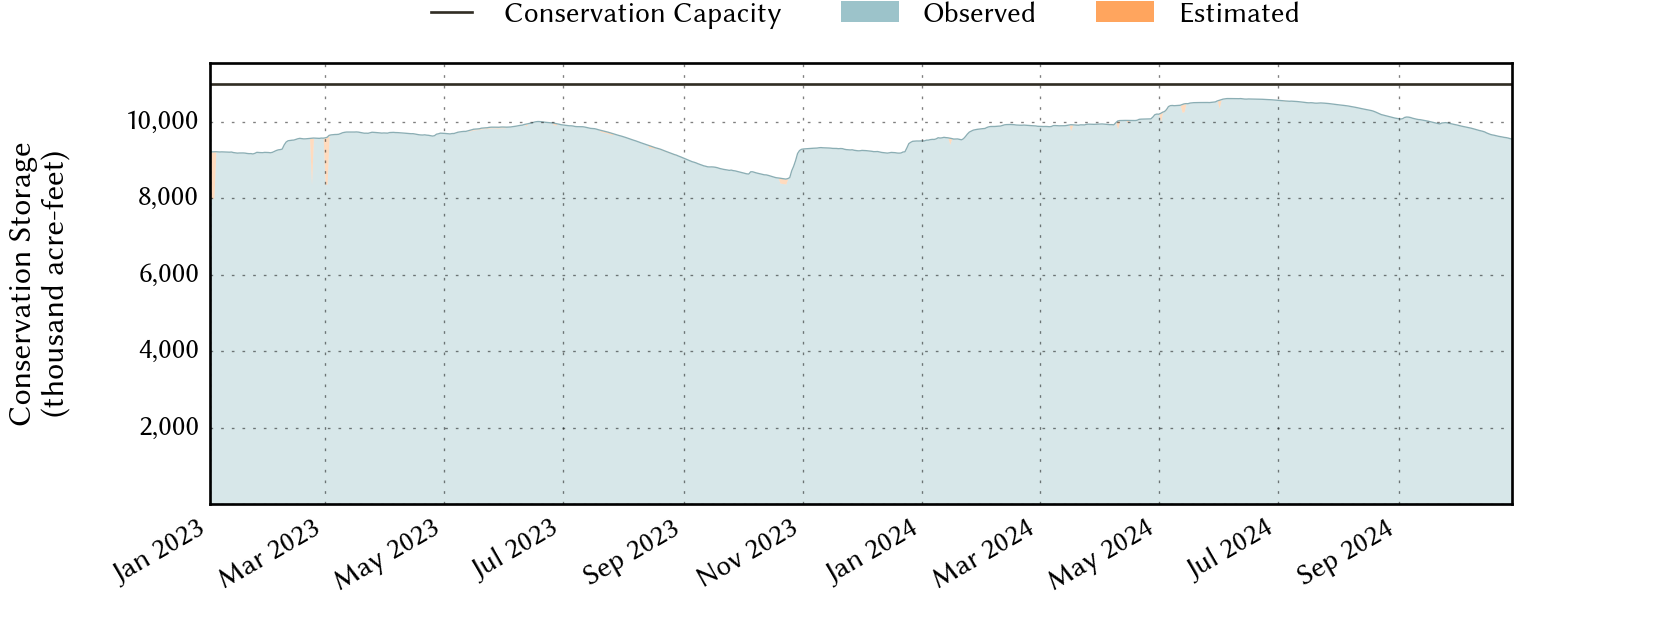
| 6 months ago | 2024-10-26 | 87.2 | 10,867,489 | 9,580,500 | 10,984,350 |
| 1 year ago | 2024-04-26 | 91.7 | 11,635,015 | 10,070,083 | 10,984,350 |
*
Percent Full is based on Conservation Storage and Conservation Capacity and doesn't account for storage in flood pool.
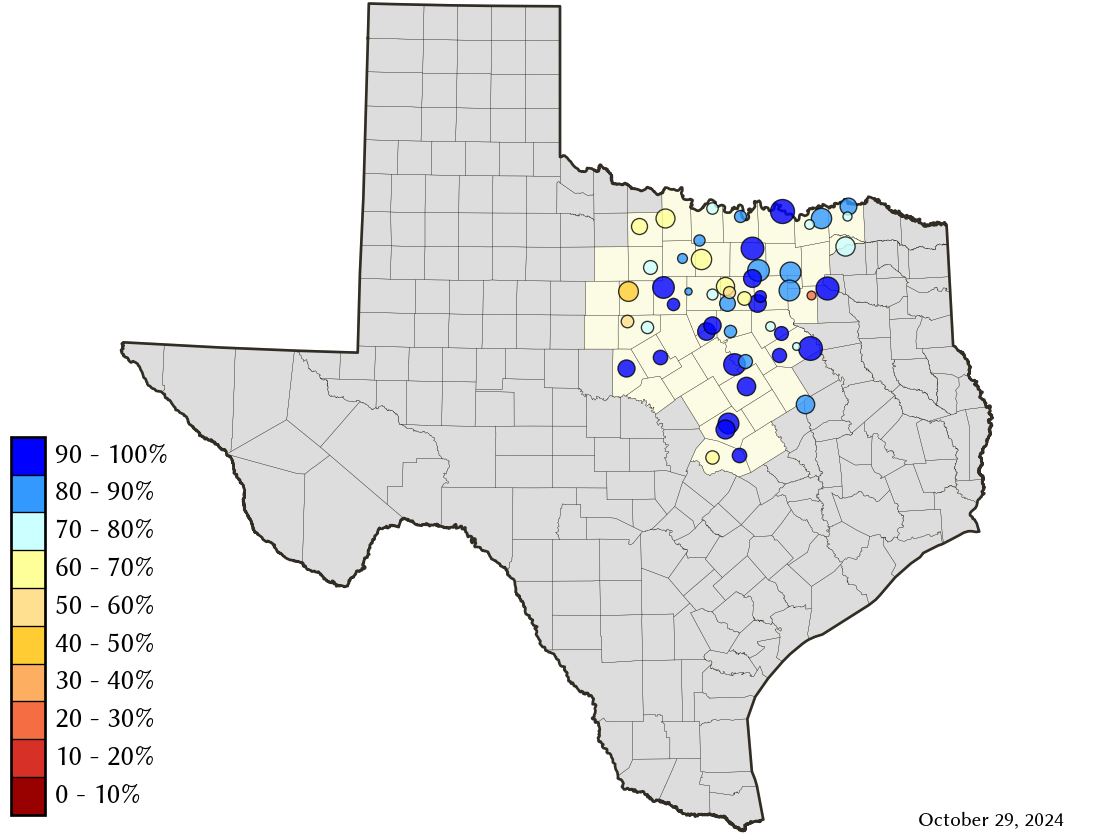
Area Map
Reservoir Storage
| Reservoir | Type | Percent Full |
Water Level (ft) |
Height Above Conservation Pool (ft) |
Reservoir Storage (acre-ft) |
Conservation Storage (acre-ft) |
Conservation Capacity (acre-ft) |
Surface Area (acres) |
|---|---|---|---|---|---|---|---|---|
| Amon G Carter |

|
100.0 | 925.43 | 5.43 | 29,845 | 19,266 | 19,266 | 1,870 |
| Aquilla |

|
100.0 | 537.91 | 0.41 | 44,553 | 43,243 | 43,243 | 3,132 |
| Arlington |
|
100.0 | 550.58 | 0.58 | 41,308 | 40,157 | 40,157 | - n.a. - |
| Arrowhead |
|
72.8 | 921.29 | -4.71 | 167,758 | 167,758 | 230,359 | 12,077 |
| Bardwell |
|
100.0 | 421.40 | 0.40 | 45,248 | 43,856 | 43,856 | 3,344 |
| Belton |
|
91.2 | 590.83 | -3.17 | 394,490 | 394,490 | 432,631 | 11,642 |
| Benbrook |
|
99.7 | 693.94 | -0.06 | 85,428 | 85,428 | 85,648 | 3,629 |
| Bois d'Arc |
|
92.3 | 532.25 | -1.75 | 339,484 | 339,484 | 367,609 | 15,769 |
| Bonham |
|
98.8 | 564.88 | -0.12 | 10,912 | 10,900 | 11,027 | 1,046 |
| Bridgeport |
|
95.9 | 834.75 | -1.25 | 356,983 | 356,983 | 372,183 | 11,982 |
| Brownwood |
|
100.0 | 1,425.64 | 1.04 | 135,933 | 130,868 | 130,868 | 6,946 |
| Cisco |
|
57.5 | 1,509.54 | -12.92 | 16,665 | 16,665 | 29,003 | 727 |
| Crook |
|
98.9 | 475.90 | -0.10 | 9,106 | 9,091 | 9,195 | 1,046 |
| Eagle Mountain |
|
84.1 | 645.73 | -3.37 | 155,716 | 155,716 | 185,087 | 8,247 |
| Georgetown |
|
67.0 | 780.22 | -10.78 | 25,517 | 25,454 | 38,005 | 1,023 |
| Graham |
|
100.0 | 1,075.99 | 0.99 | 47,786 | 45,288 | 45,288 | - n.a. - |
| Granbury |
|
93.4 | 691.60 | -1.10 | 125,089 | 124,180 | 132,949 | 7,771 |
| Granger |
|
100.0 | 504.21 | 0.21 | 52,689 | 51,822 | 51,822 | - n.a. - |
| Grapevine |
|
100.0 | 536.72 | 1.72 | 174,773 | 163,064 | 163,064 | - n.a. - |
| Halbert |
|
98.0 | 367.79 | -0.21 | 5,912 | 5,912 | 6,033 | 573 |
| Hubbard Creek |
|
49.0 | 1,170.67 | -12.64 | 158,327 | 153,451 | 313,298 | 9,834 |
| Hubert H Moss |
|
100.0 | 715.81 | 0.81 | 25,038 | 24,058 | 24,058 | - n.a. - |
| Jim Chapman |
|
100.0 | 440.32 | 0.32 | 300,286 | 258,723 | 258,723 | 18,182 |
| Joe Pool |
|
100.0 | 522.60 | 0.60 | 155,055 | 149,629 | 149,629 | 6,821 |
| Kickapoo |
|
70.1 | 1,040.14 | -4.86 | 60,531 | 60,531 | 86,345 | 4,759 |
| Lavon |
|
100.0 | 492.63 | 0.63 | 425,716 | 409,757 | 409,757 | 20,983 |
| Leon |
|
100.0 | 1,375.28 | 0.28 | 28,537 | 27,762 | 27,762 | - n.a. - |
| Lewisville |
|
94.6 | 520.85 | -1.15 | 568,292 | 532,618 | 563,228 | 26,252 |
| Limestone |
|
93.2 | 361.86 | -1.14 | 189,860 | 189,860 | 203,780 | 12,022 |
| Lost Creek |
|
100.0 | 1,010.65 | 1.15 | 12,431 | 11,950 | 11,950 | - n.a. - |
| Mineral Wells |
|
90.2 | 861.86 | -1.14 | 4,756 | 4,756 | 5,273 | 442 |
| Mountain Creek |
|
100.0 | 457.63 | 0.63 | 24,506 | 22,850 | 22,850 | 2,867 |
| Navarro Mills |
|
100.0 | 427.15 | 2.65 | 62,985 | 49,827 | 49,827 | - n.a. - |
| New Terrell City |
|
33.4 | 495.41 | -8.59 | 2,879 | 2,868 | 8,583 | 437 |
| Nocona |
|
100.0 | 828.66 | 1.16 | 23,328 | 21,444 | 21,444 | - n.a. - |
| Palo Pinto |
|
97.8 | 866.73 | -0.27 | 26,566 | 26,180 | 26,766 | 2,164 |
| Pat Cleburne |
|
100.0 | 733.97 | 0.47 | 26,748 | 26,008 | 26,008 | - n.a. - |
| Pat Mayse |
|
100.0 | 452.37 | 1.37 | 125,669 | 113,683 | 113,683 | - n.a. - |
| Possum Kingdom |
|
98.5 | 998.56 | -0.44 | 530,302 | 530,302 | 538,139 | 17,709 |
| Proctor |
|
100.0 | 1,163.67 | 1.67 | 62,730 | 54,762 | 54,762 | - n.a. - |
| Ray Hubbard |
|
99.9 | 435.47 | -0.03 | 438,932 | 438,932 | 439,559 | 20,910 |
| Ray Roberts |
|
100.0 | 632.95 | 0.45 | 801,319 | 788,167 | 788,167 | - n.a. - |
| Richland-Chambers |
|
100.0 | 315.64 | 0.64 | 1,153,444 | 1,099,417 | 1,099,417 | - n.a. - |
| Squaw Creek |
|
100.0 | 775.58 | 0.58 | 153,117 | 151,250 | 151,250 | - n.a. - |
| Stillhouse Hollow |
|
88.9 | 617.83 | -4.17 | 204,277 | 204,191 | 229,796 | 5,838 |
| Tawakoni |
|
100.0 | 437.94 | 0.44 | 888,066 | 871,685 | 871,685 | - n.a. - |
| Texoma 1 |
|
100.0 | 619.80 | 2.80 | 2,713,690 | 1,243,801 | 1,243,801 | 87,934 |
| Waco |
|
92.9 | 460.50 | -1.70 | 176,120 | 175,914 | 189,418 | 7,794 |
| Waxahachie |
|
100.0 | 531.97 | 0.47 | 11,958 | 11,060 | 11,060 | 684 |
| Weatherford |
|
71.2 | 890.89 | -5.11 | 12,684 | 12,684 | 17,812 | 932 |
| Whitney |
|
100.0 | 534.69 | 1.69 | 606,718 | 564,808 | 564,808 | - n.a. - |
| Worth |
|
68.1 | 591.63 | -2.37 | 25,710 | 16,634 | 24,419 | 3,131 |
footnotes
1
Lake Texoma straddles the border of Texas and Oklahoma, Texas has rights to 50% of Lake Texoma's total conservation capacity. Percent full, conservation storage and conservation capacity are based on the Texas share.