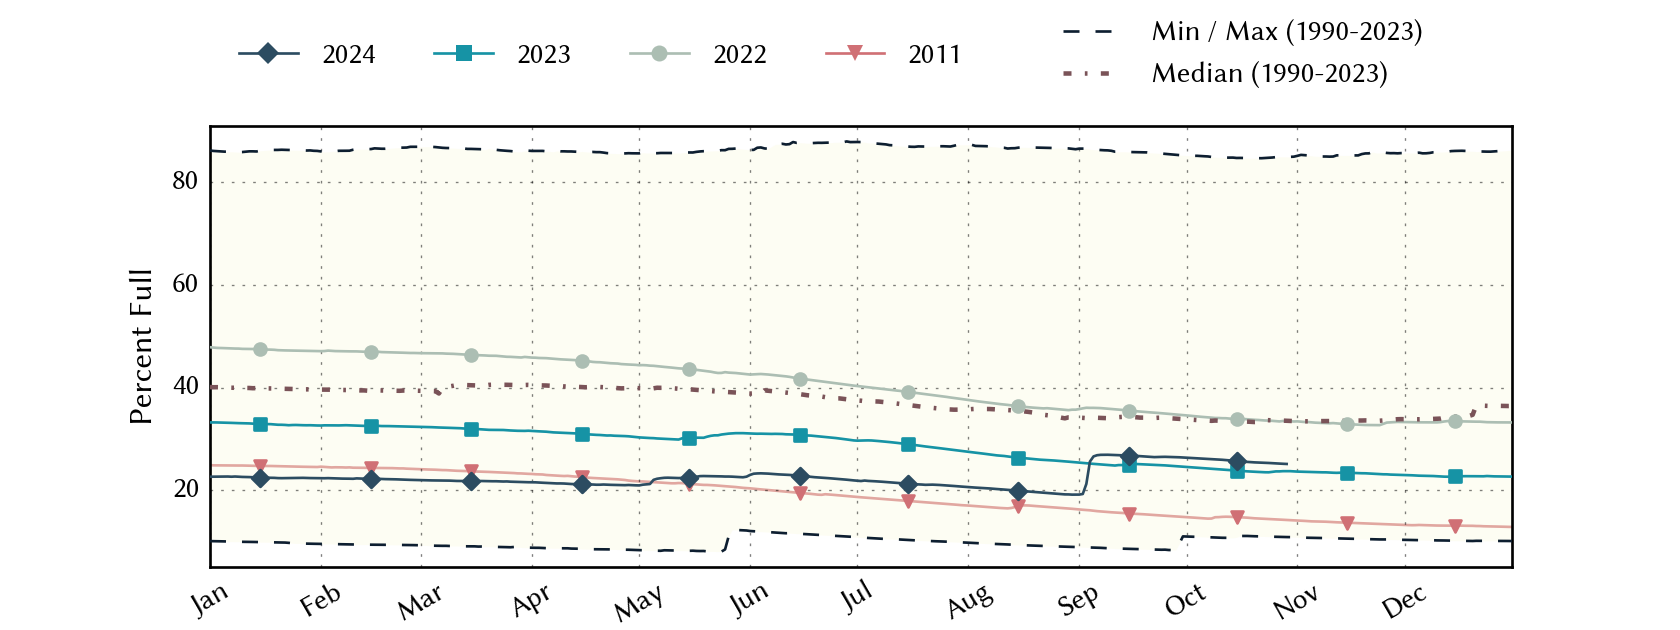
San Angelo Area Reservoirs: Monitored Water Supply Reservoirs are 31.0% full on 2025-04-26
Historical Data
| Date | Percent Full |
Reservoir Storage (acre-ft) |
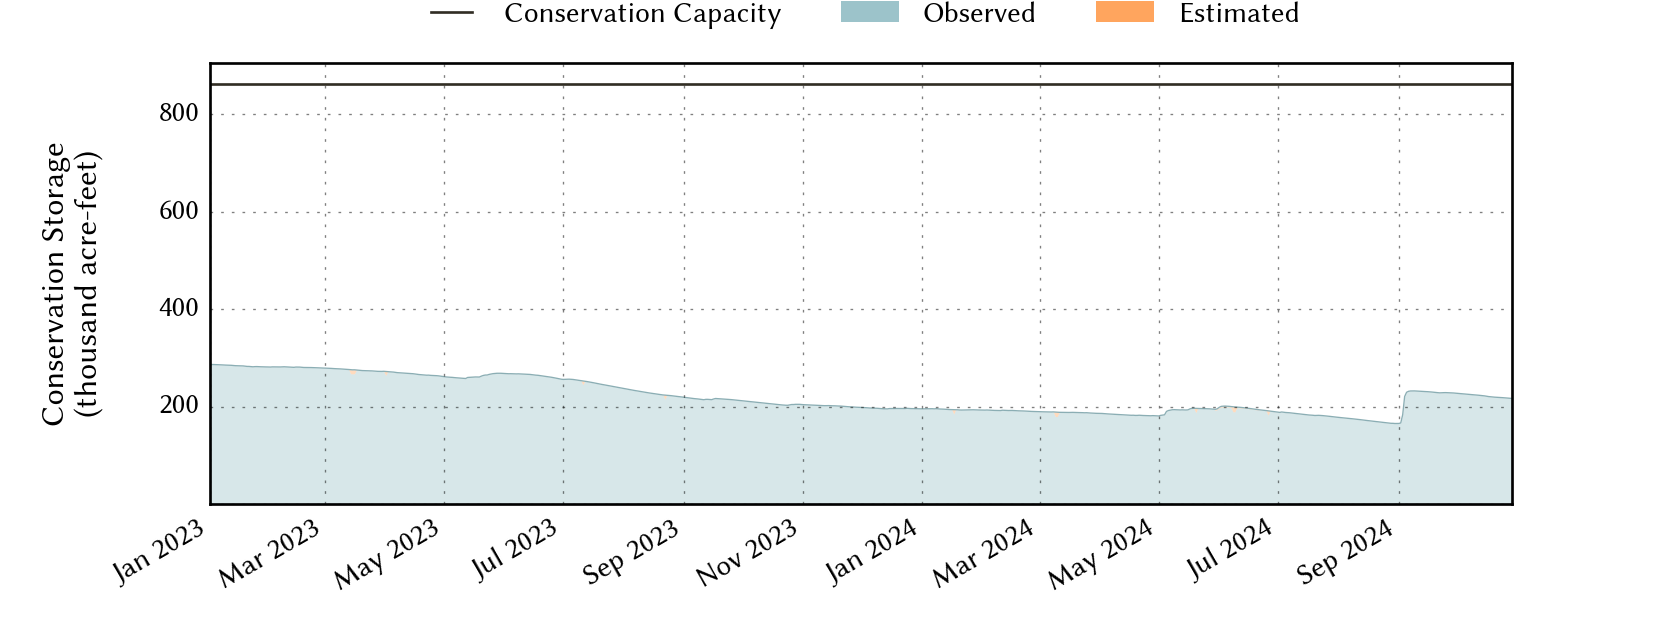
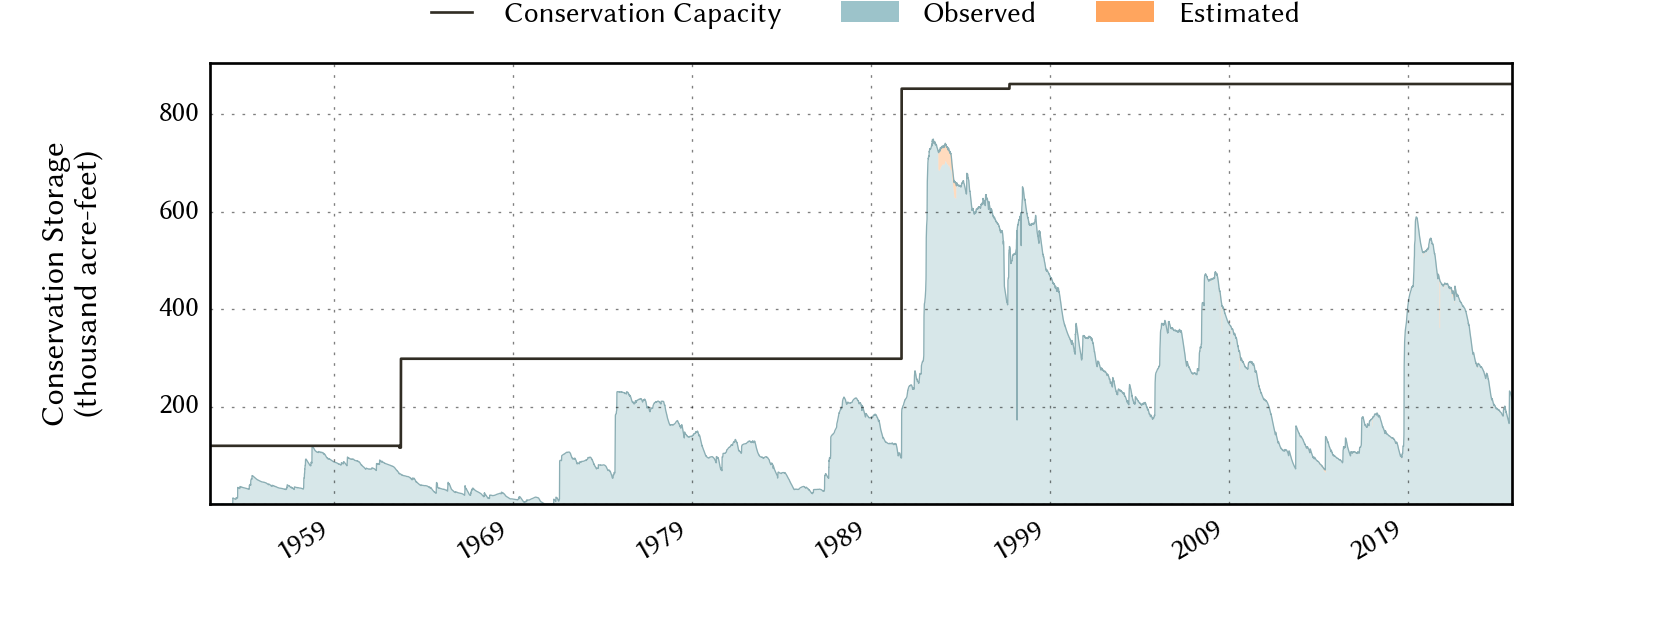
Conservation Storage (acre-ft) |
Conservation Capacity (acre-ft) |
|
|---|---|---|---|---|---|
| Today | 2025-04-26 | 31.0 | 271,585 | 267,342 | 862,151 |
| Yesterday | 2025-04-25 | 30.9 | 271,057 | 266,814 | 862,151 |
| 2 days ago | 2025-04-24 | 30.9 | 270,368 | 266,125 | 862,151 |
| 1 week ago | 2025-04-19 | 28.4 | 249,414 | 245,171 | 862,151 |
| 1 month ago | 2025-03-26 | 28.8 | 252,482 | 248,239 | 862,151 |
| 3 months ago | 2025-01-26 | 29.5 | 258,459 | 254,216 | 862,151 |
| 6 months ago | 2024-10-26 | 25.2 | 221,847 | 217,604 | 862,151 |
| 1 year ago | 2024-04-26 | 21.0 | 185,642 | 181,399 | 862,151 |
*
Percent Full is based on Conservation Storage and Conservation Capacity and doesn't account for storage in flood pool.
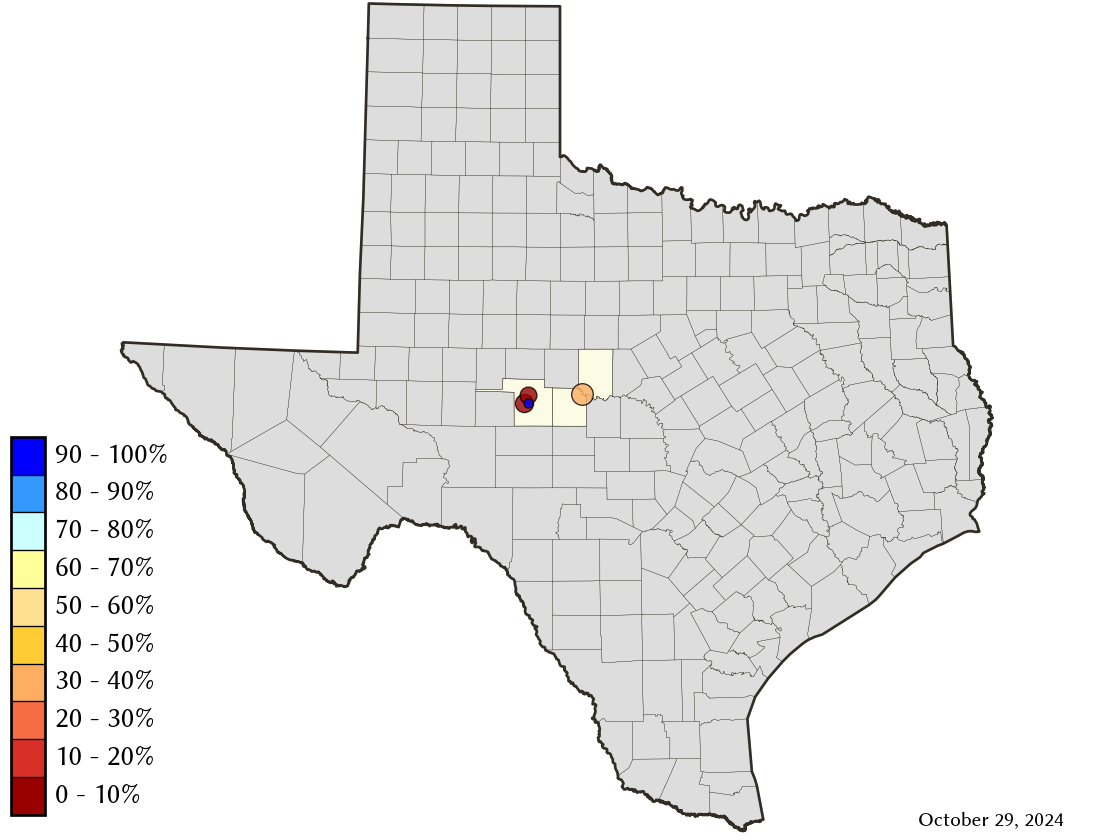
Area Map
Reservoir Storage
| Reservoir | Type | Percent Full |
Water Level (ft) |
Height Above Conservation Pool (ft) |
Reservoir Storage (acre-ft) |
Conservation Storage (acre-ft) |
Conservation Capacity (acre-ft) |
Surface Area (acres) |
|---|---|---|---|---|---|---|---|---|
| Nasworthy |

|
92.0 | 1,871.71 | -0.49 | 9,339 | 8,846 | 9,615 | 1,271 |
| O C Fisher |

|
9.8 | 1,871.18 | -36.82 | 11,380 | 11,379 | 115,742 | 1,015 |
| O H Ivie |
|
40.0 | 1,528.57 | -22.93 | 221,886 | 221,886 | 554,340 | - n.a. - |
| Twin Buttes |
|
13.8 | 1,906.67 | -33.53 | 28,980 | 25,231 | 182,454 | 1,900 |