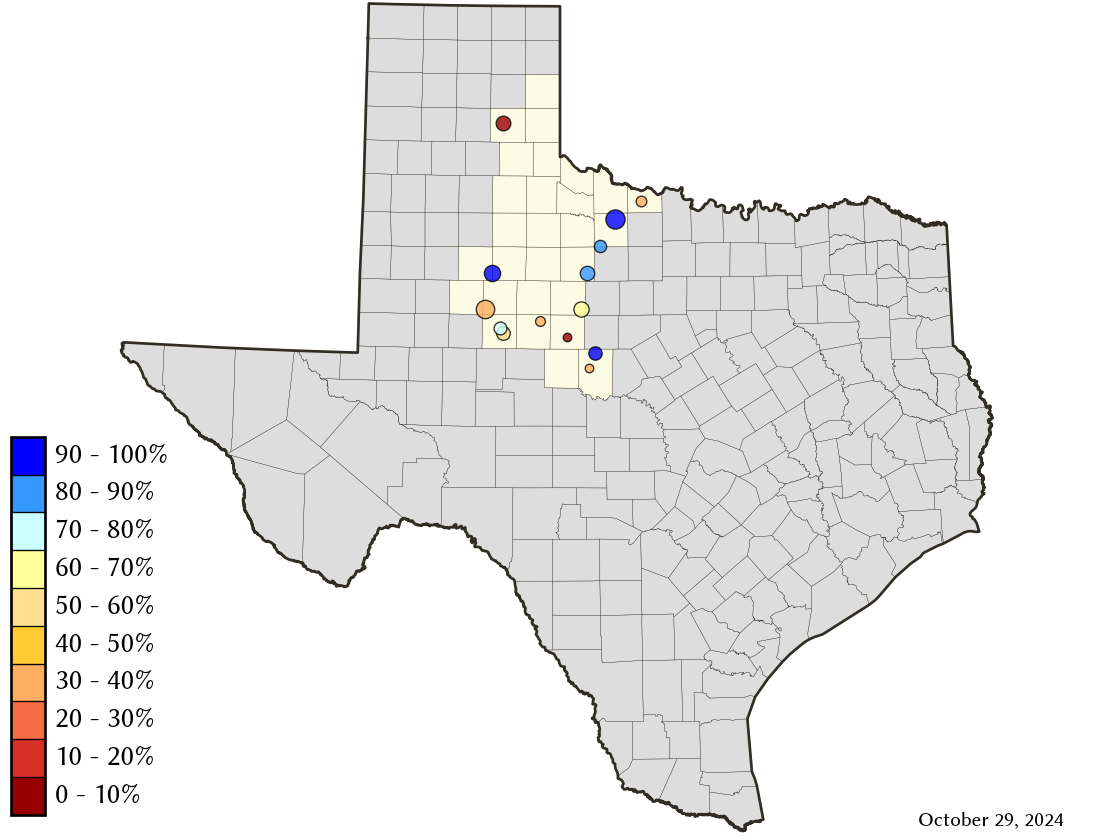
Low-Rolling-Plains Climate Division Reservoirs: Monitored Water Supply Reservoirs are 69.9% full on 2025-04-26
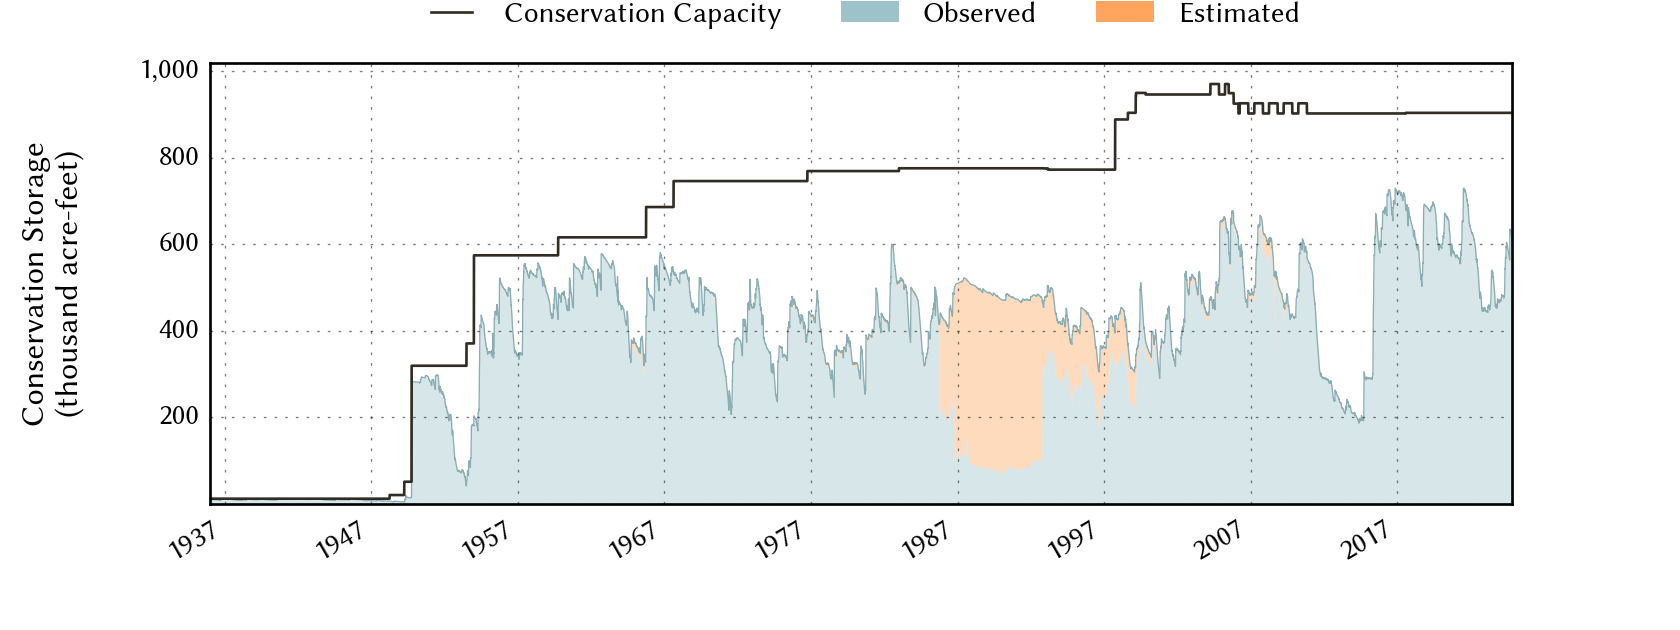
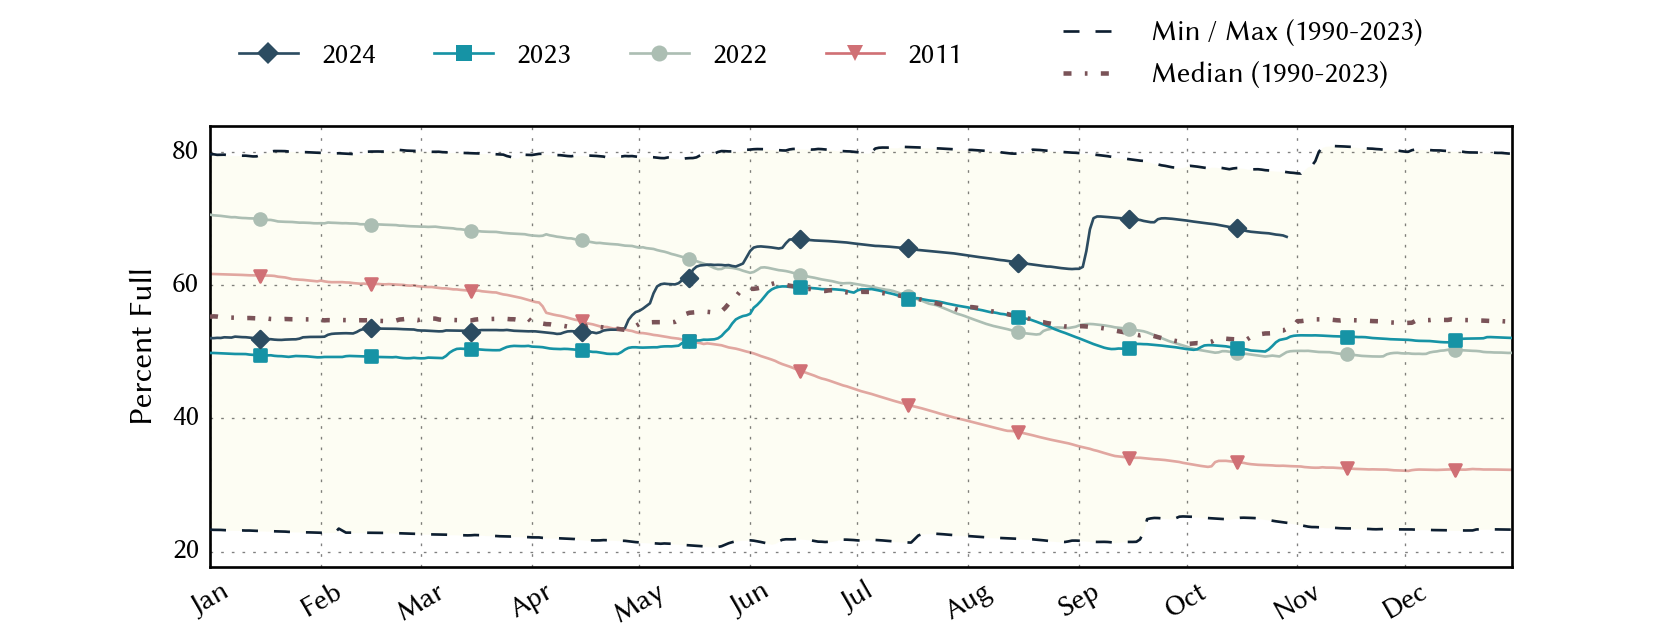
Historical Data
| Date | Percent Full |
Reservoir Storage (acre-ft) |
Conservation Storage (acre-ft) |
Conservation Capacity (acre-ft) |
|
|---|---|---|---|---|---|
| Today | 2025-04-26 | 69.9 | 653,168 | 631,548 | 903,870 |
| Yesterday | 2025-04-25 | 69.9 | 651,158 | 631,421 | 903,870 |
| 2 days ago | 2025-04-24 | 69.7 | 643,344 | 630,171 | 903,870 |
| 1 week ago | 2025-04-19 | 68.7 | 628,978 | 620,738 | 903,870 |
| 1 month ago | 2025-03-26 | 69.0 | 629,829 | 623,443 | 903,870 |
| 3 months ago | 2025-01-26 | 70.6 | 647,775 | 638,139 | 903,870 |
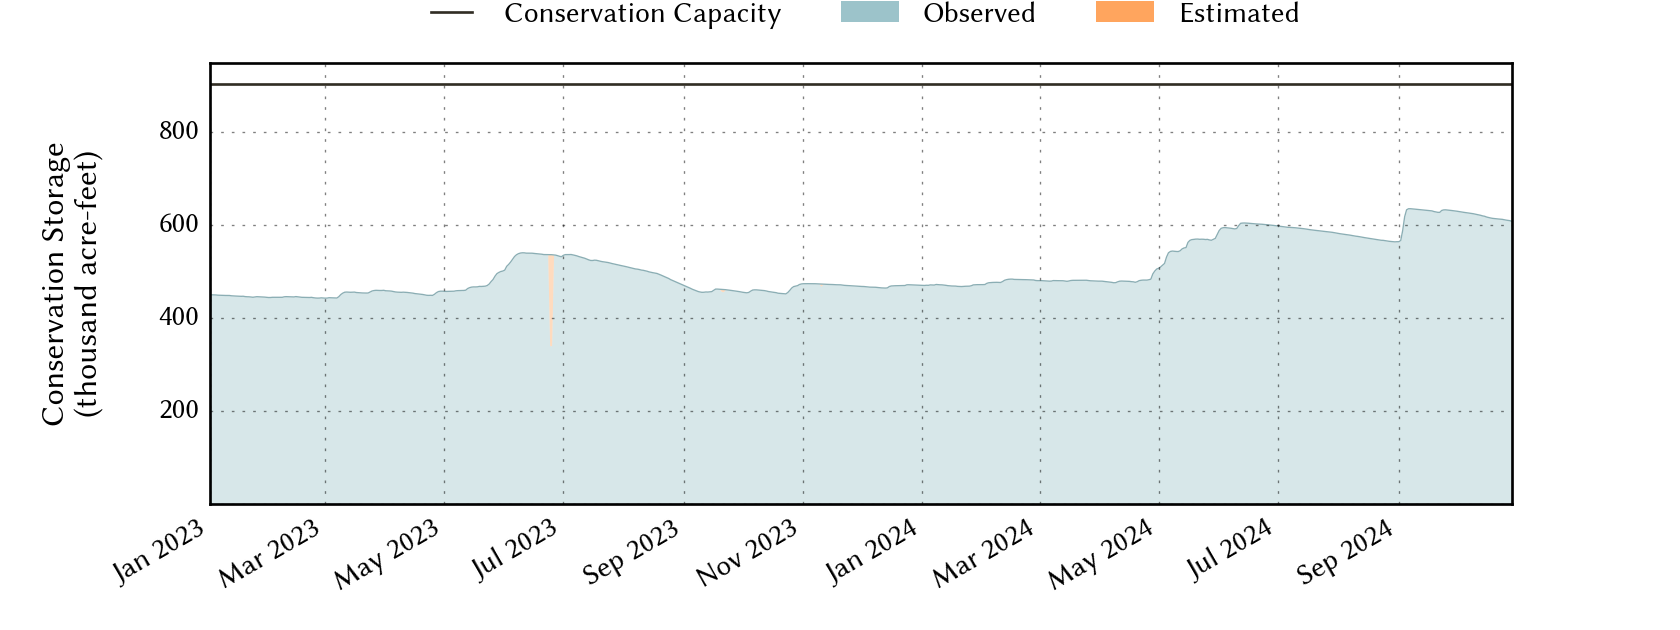
| 6 months ago | 2024-10-26 | 67.5 | 613,101 | 610,557 | 903,870 |
| 1 year ago | 2024-04-26 | 53.4 | 485,184 | 482,640 | 903,870 |
*
Percent Full is based on Conservation Storage and Conservation Capacity and doesn't account for storage in flood pool.
Area Map
Reservoir Storage
| Reservoir | Type | Percent Full |
Water Level (ft) |
Height Above Conservation Pool (ft) |
Reservoir Storage (acre-ft) |
Conservation Storage (acre-ft) |
Conservation Capacity (acre-ft) |
Surface Area (acres) |
|---|---|---|---|---|---|---|---|---|
| Abilene |

|
6.7 | 1,990.87 | -21.43 | 531 | 531 | 7,900 | 126 |
| Alan Henry |
|
93.7 | 2,217.78 | -2.22 | 90,164 | 90,164 | 96,207 | 2,643 |
| Champion Creek |
|
46.7 | 2,064.45 | -18.55 | 19,406 | 19,406 | 41,580 | 908 |
| Coleman |
|
100.0 | 1,719.16 | 1.66 | 41,147 | 38,075 | 38,075 | - n.a. - |
| Colorado City |
|
69.5 | 2,063.13 | -7.07 | 21,379 | 21,379 | 30,758 | - n.a. - |
| Fort Phantom Hill |
|
71.9 | 1,630.26 | -5.64 | 50,364 | 50,358 | 70,030 | 3,101 |
| Greenbelt |
|
9.1 | 2,614.91 | -49.09 | 5,916 | 5,484 | 59,968 | 407 |
| Hords Creek |

|
61.9 | 1,892.69 | -7.31 | 5,022 | 5,019 | 8,109 | 347 |
| J B Thomas |
|
38.0 | 2,235.97 | -22.03 | 76,714 | 76,041 | 199,931 | 4,243 |
| Kemp |
|
100.0 | 1,145.03 | 1.03 | 261,455 | 245,307 | 245,307 | - n.a. - |
| Millers Creek |
|
78.9 | 1,331.23 | -2.77 | 22,398 | 21,115 | 26,768 | 1,844 |
| North Fork Buffalo Creek |
|
38.5 | 1,040.37 | -7.63 | 5,934 | 5,934 | 15,400 | 796 |
| Stamford |
|
94.2 | 1,416.44 | -0.36 | 48,580 | 48,577 | 51,570 | 4,911 |
| Sweetwater |
|
33.9 | 2,099.02 | -17.48 | 4,158 | 4,158 | 12,267 | 310 |